Report Highlights:
-
Republicans are 2.25 times more likely to own firearms than Democrats.
-
Independent voters reported 29% ownership rate in 2000 and 2023, lower than Republicans and higher than Democrats.
-
Republican women are 14% more likely to own guns than Democrat men.
-
Protection is the main reason for gun ownership across all political parties.
Related Studies: Gun Ownership by State | Firearm Ownership in America | Most Gun-Friendly States
Methodology
Gun ownership data were drawn from nationally representative surveys conducted by Pew Research Center, Gallup, the General Social Survey, and YouGov between 2000 and 2024.
Figures reflect self-reported, personal firearm ownership among voters who identified as Democrats, Republicans, or independents. Where only household data were available, this is noted. Trend comparisons used consistent question wording across survey years.
Gun Ownership by Political Party in 2025
According to surveys in 2024, Republicans are 2.5 times more likely to own firearms than Democrats.1, 2, 4, 5
Nearly half (45%) of Republican voters stated they own a firearm, while less than one quarter (20%) of Democrats said the same.
What Percentage of Democrats Own Guns?
In 2024, 20% of Democrat voters reported owning firearms, making them the voter group least likely to own firearms.
What Percentage of Republicans Own Guns?
In 2024, 45% of Republican voters reported owning firearms. Republicans were 2.25 times more likely to own guns than Democrats, and 1.55 times more likely to own guns than independents.
What Percentage of Independents Own Guns?
Between 2019 and 2024, 29% of independents reported owning firearms. Independent voters reported a spike in ownership in 2013, with some surveys showing rates as high as 44%.
Gun Ownership by Political Party: Trends Over Time
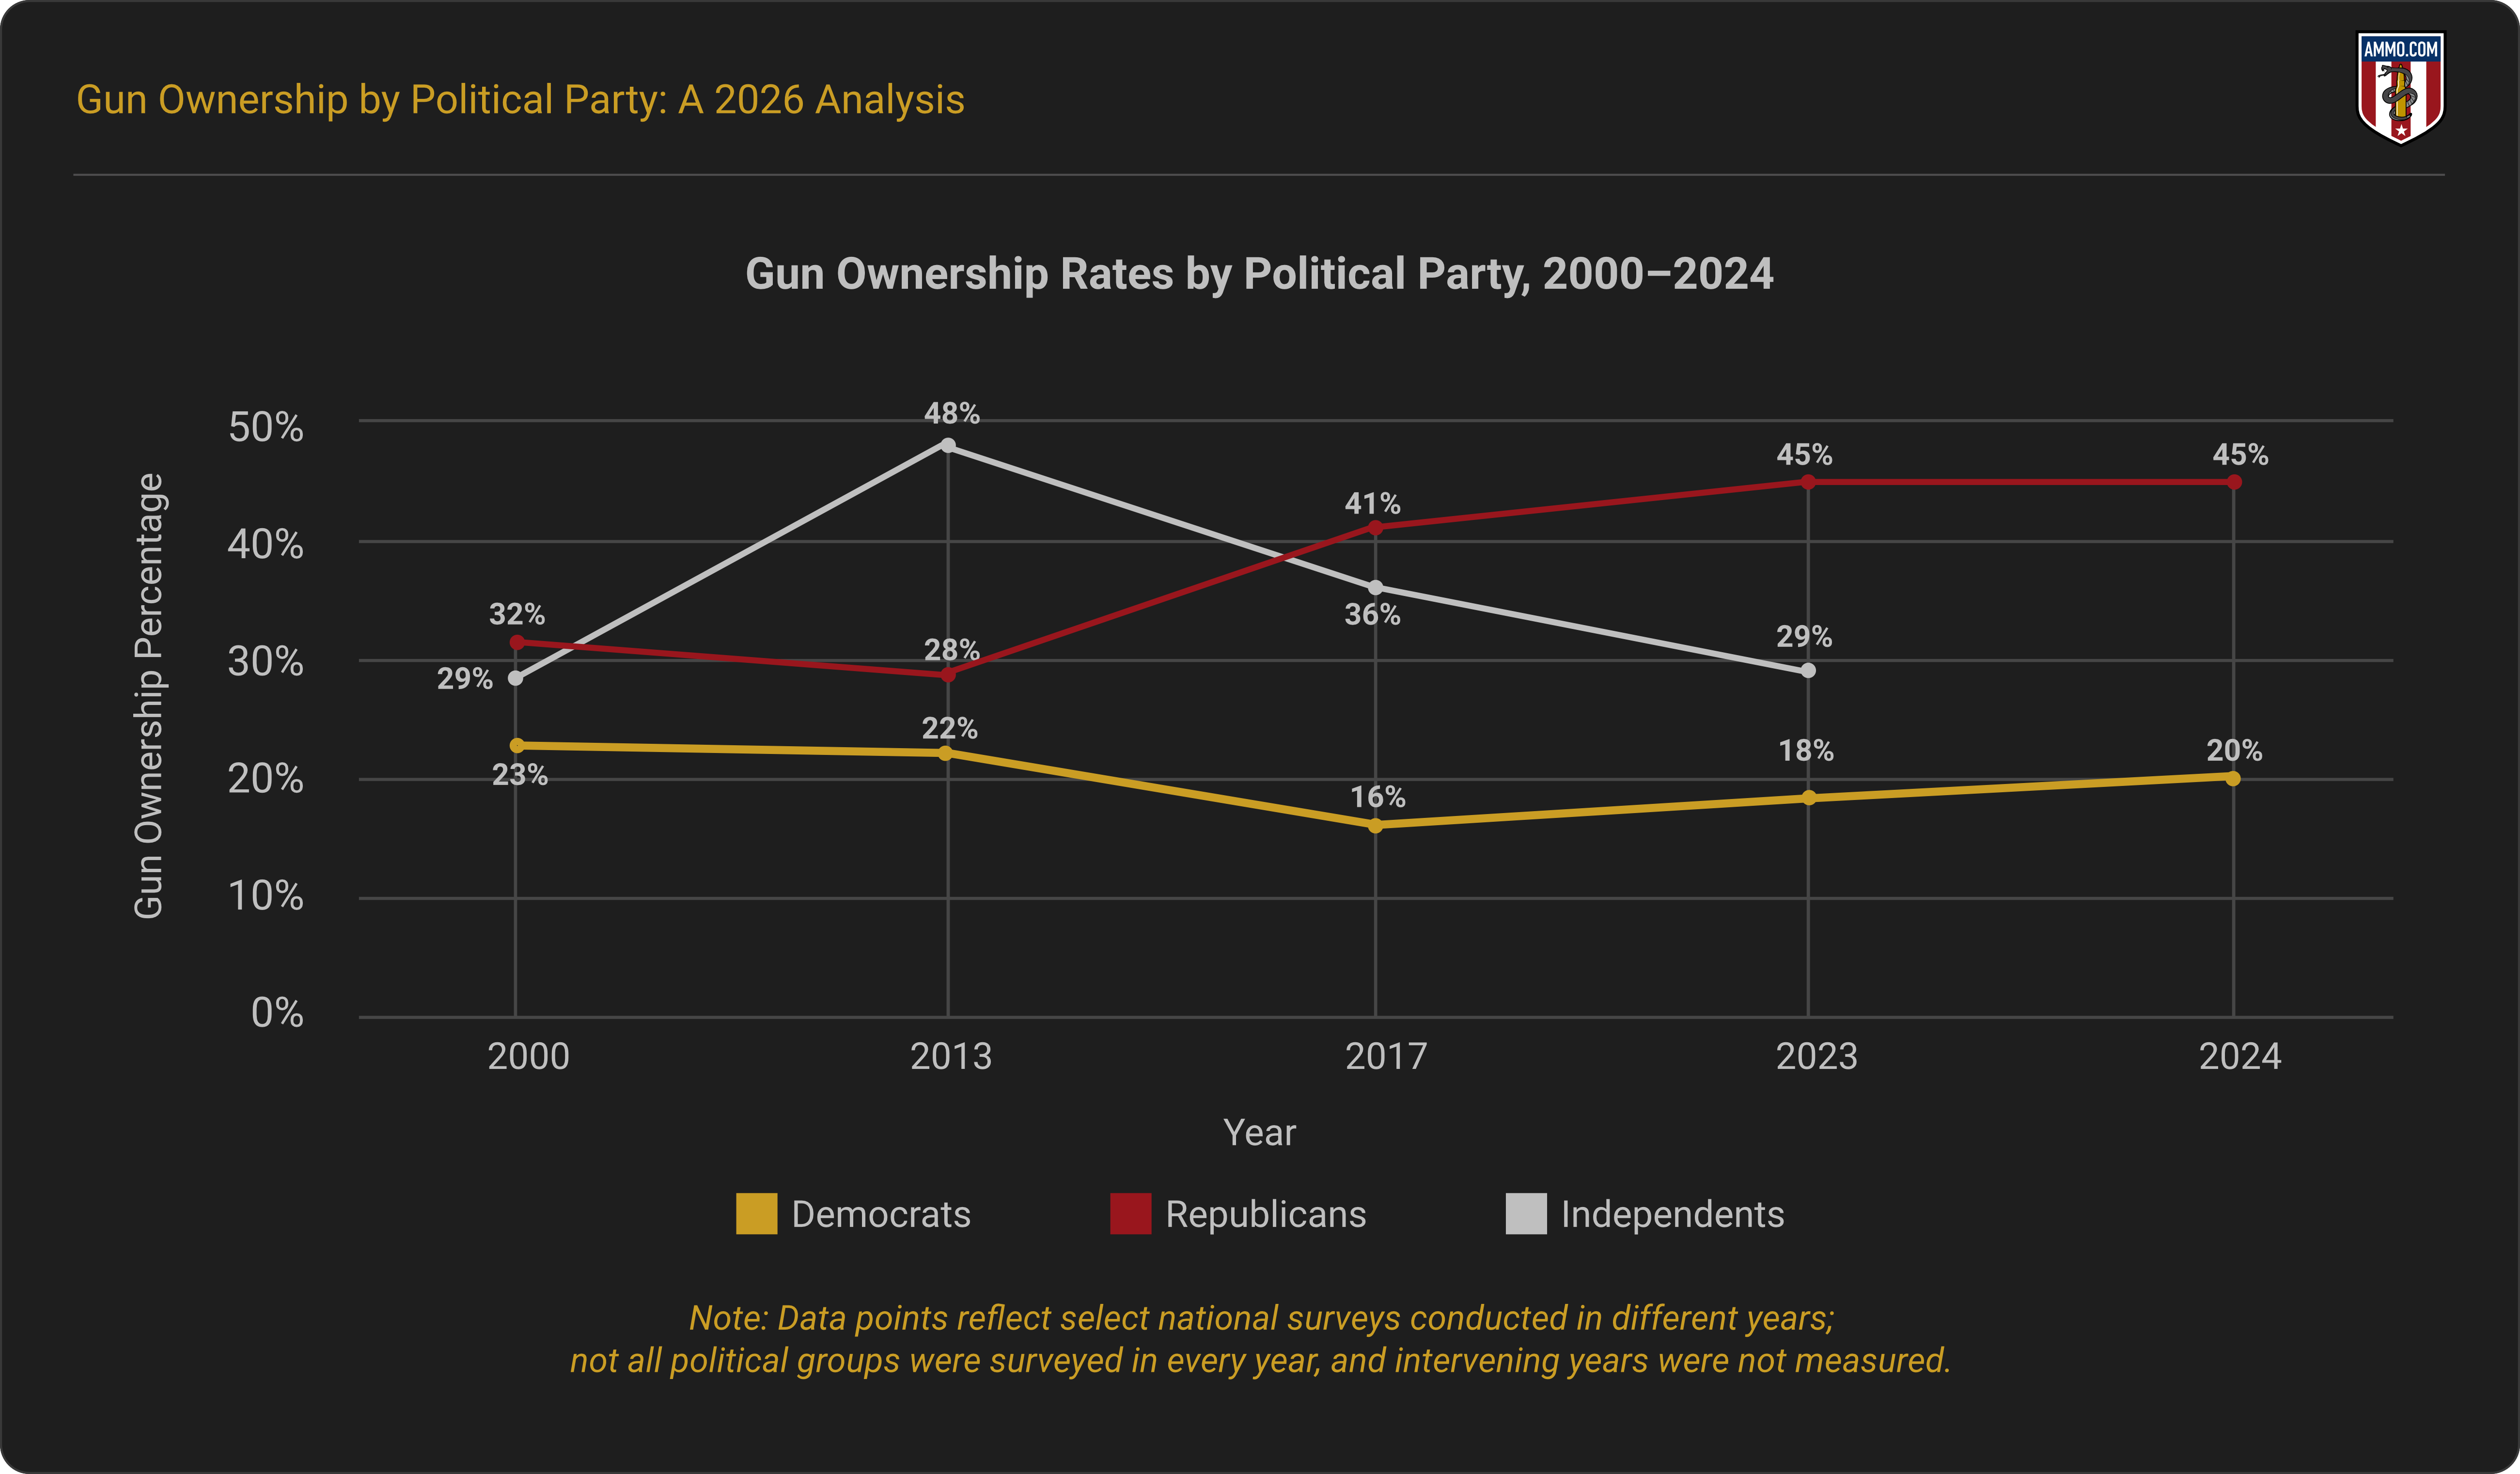
In 2000, 32% of Republicans reported owning firearms, compared to 23% of Democrats and 29% of independents. 1, 2, 5
The gap between gun ownership among political parties has broadened over the past 25 years. Democrat gun ownership has declined by three percentage points since 2000, while Republican ownership has increased by 13 percentage points.
Independents reported 29% ownership in 2000 and 29% ownership in 2023 (when they were last surveyed), with spikes in ownership reported in 2013 ( 48%) and 2017 (36%).
Gun Ownership by Political Party: Gender
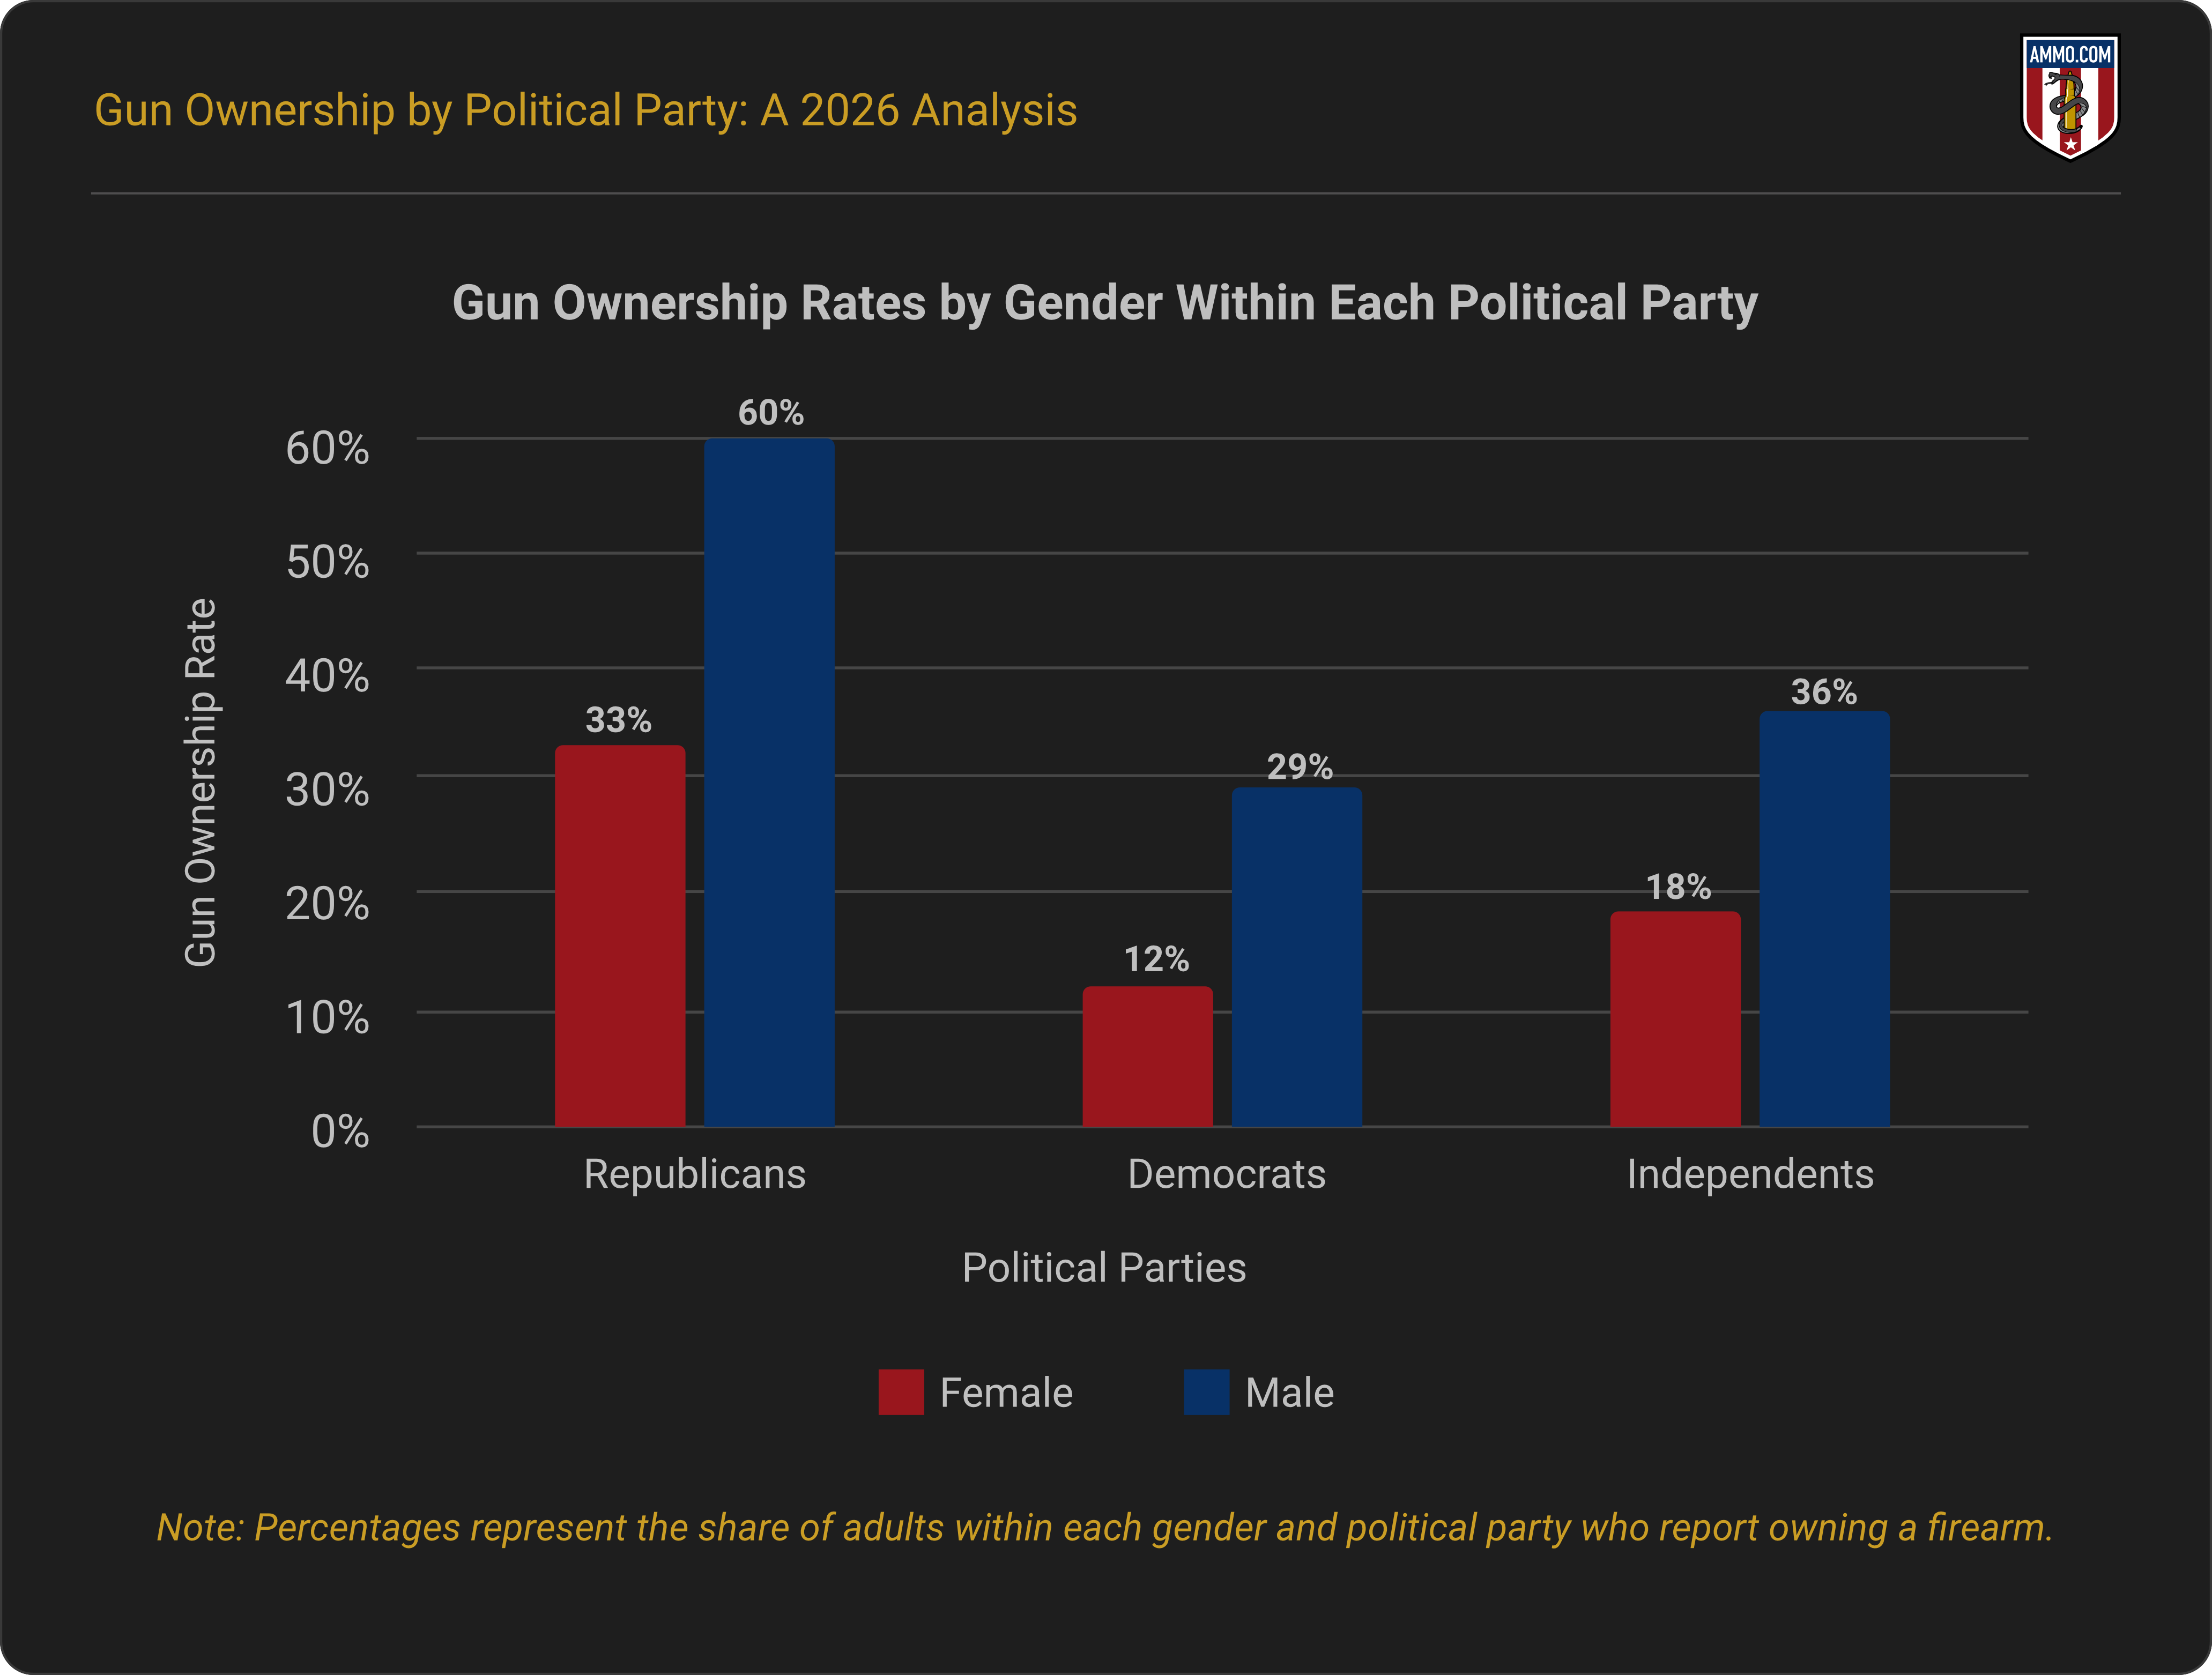
In 2024, Republican males were most likely to own firearms (60%) of all genders and voters. Independent male voters followed at 39% ownership. 2
Republican women (33%) were more likely to own guns than Democrat men (29%), Democrat women (12%), and independent women (18%).
Democrat Gun Ownership by Gender
In 2024, 29% of Democrat men stated they owned firearms, while only 12% of Democrat females stated the same.
Republican Gun Ownership by Gender
Republican men were more likely than Republican women to own guns in 2024: 60% and 33%, respectively.
Independent Gun Ownership by Gender
Independent men are more likely than independent women to own guns. In 2024, 18% of females stated they owned a firearm, compared to 36% of men.
Reasons for Gun Ownership by Political Party
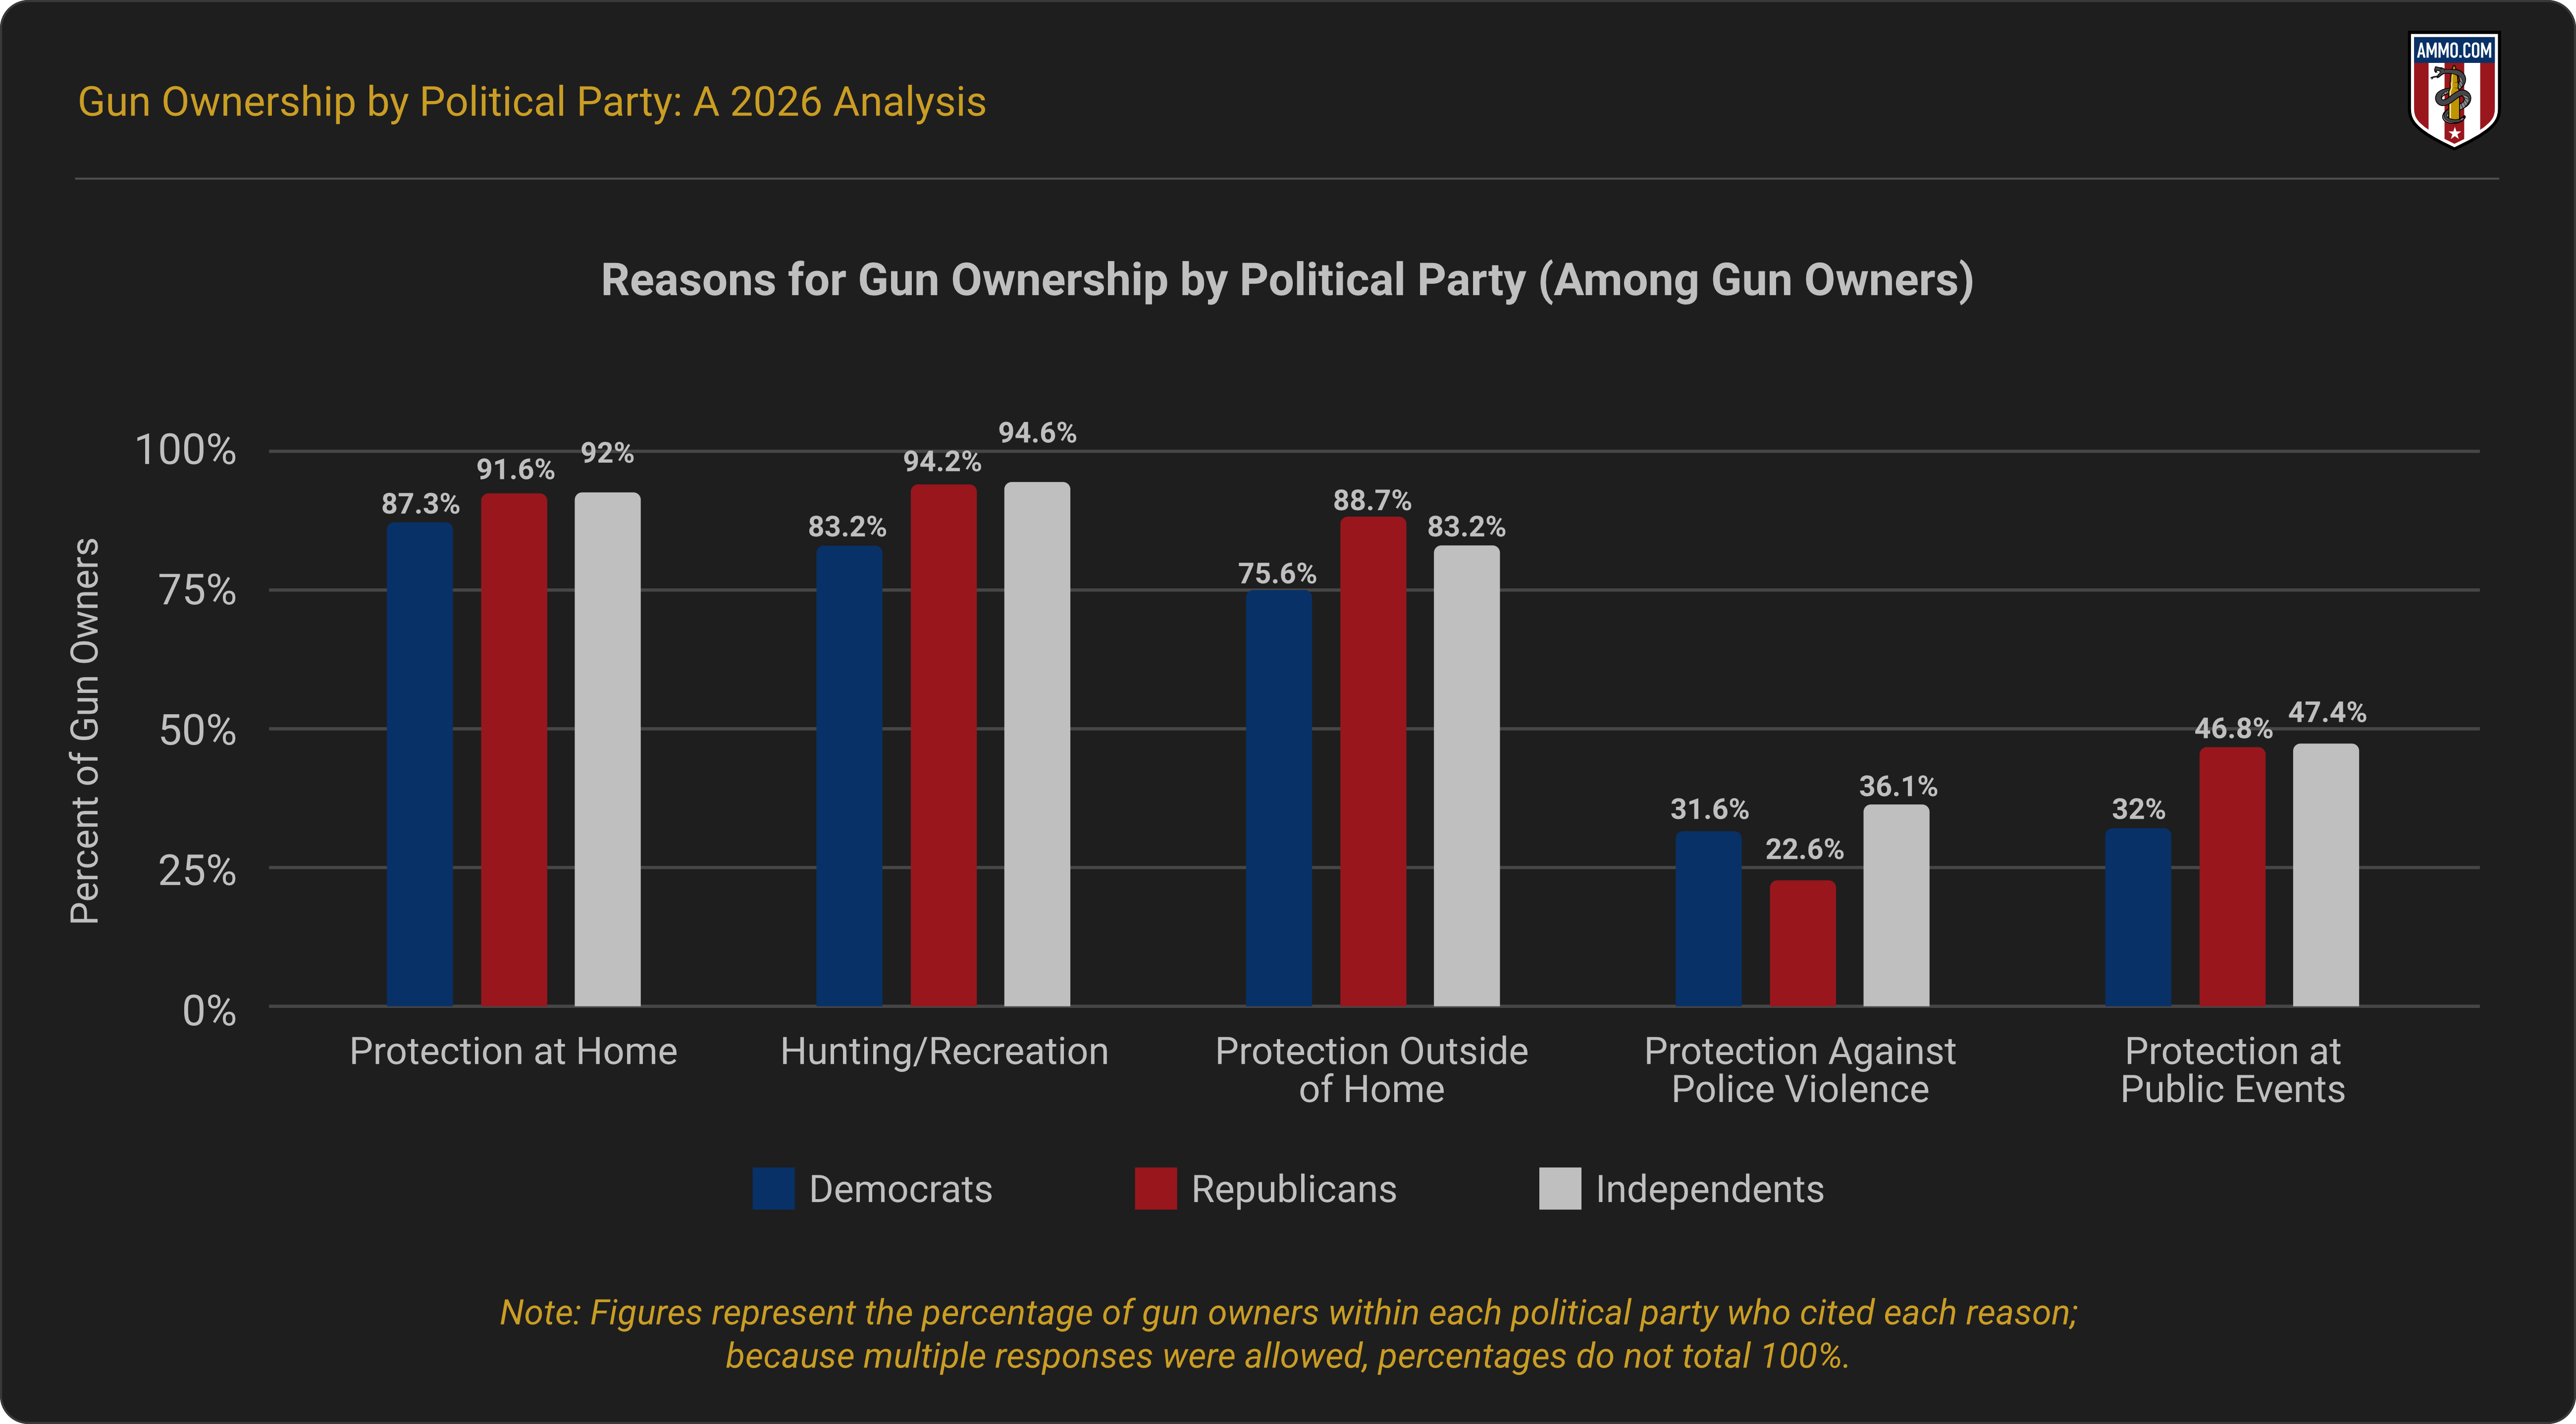
In 2024, most gun owners (91%), regardless of political party, cited “hunting or recreation” as a reason for owning a firearm. Many gun owners cited home protection (90%) and protection outside the home (83.3%). 3
Independent voters were most likely to say they own firearms for home protection (92.0%), for use against violence from the police (36.1%), hunting or recreation (94.6%), and protection at public events (47.4%).
Republican voters were most likely to cite protection outside of the home as a reason for defense (88.7%), and only slightly less likely to report owning firearms for all other categories listed.
Democrat voters were least likely to own firearms for all categories listed. Protection at home (87.3%), protection outside of the home (75.6%), and hunting or recreation (83.2%) were the most common reasons for gun ownership.
Continue reading Gun Ownership by Political Party: A 2026 Analysis on Ammo.com!