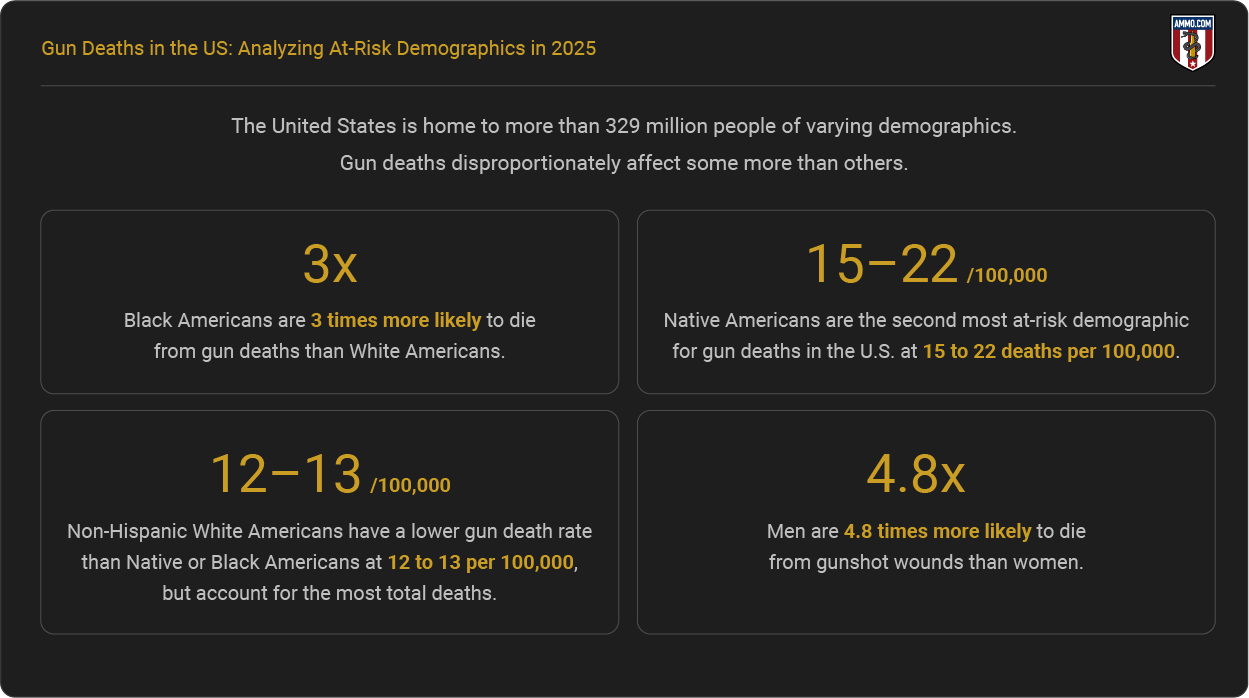
Report Highlights: The United States is home to more than 329 million people of varying demographics. Gun deaths disproportionately affect some more than others.
-
Black Americans are 3 times more likely to die from gun deaths than White Americans.
-
Native Americans are the second most at-risk demographic for gun deaths in the U.S. at 15 to 22 deaths per 100,000.
-
Non-Hispanic White Americans have a lower gun death rate than Native or Black Americans at 12 to 13 per 100,000, but account for the most total deaths.
-
Men are 4.8 times more likely to die from gunshot wounds than women.
We provide accurate and reliable information sourced from reputable databases. Our sources for this article are available HERE.
Related Studies: What Percentage of Gun Deaths are Suicides?, U.S. Firearm Deaths Per Year: A Collective Report 1968-2024, Mass Shooters by Race: Demographics of Assailants 1966-2024
The Most At-Risk Demographics
Gun deaths in the U.S. disproportionately affect certain demographics, and vary depending on race, ethnicity, age, gender, and geography. Black males between 15 and 34 years of age who live in large central metropolitan areas face the highest risk, with firearm death rates surpassing 30 per 100,000 from 2018 to 2024.
Native American males also suffer disproportionately high firearm death rates, especially in rural and nonmetropolitan regions where suicide is a leading driver. Although less likely to die from a firearm-related homicide, White males experience high suicide-related firearm deaths in small towns and rural America. Meanwhile, women of all races face much lower risks overall, although Black women in cities are at greater risk than women of other races.
At-Risk Demographics by Injury Intent
-
Suicide - Non-Hispanic White Americans (11.2 per 100,000)
-
Homicide - Non-Hispanic Black Americans (27.0 per 100,000)
-
Legal Intervention - Non-Hispanic Black Americans (0.3 per 100,000)
-
Accidental - Non-Hispanic Black Americans (0.3 per 100,000)
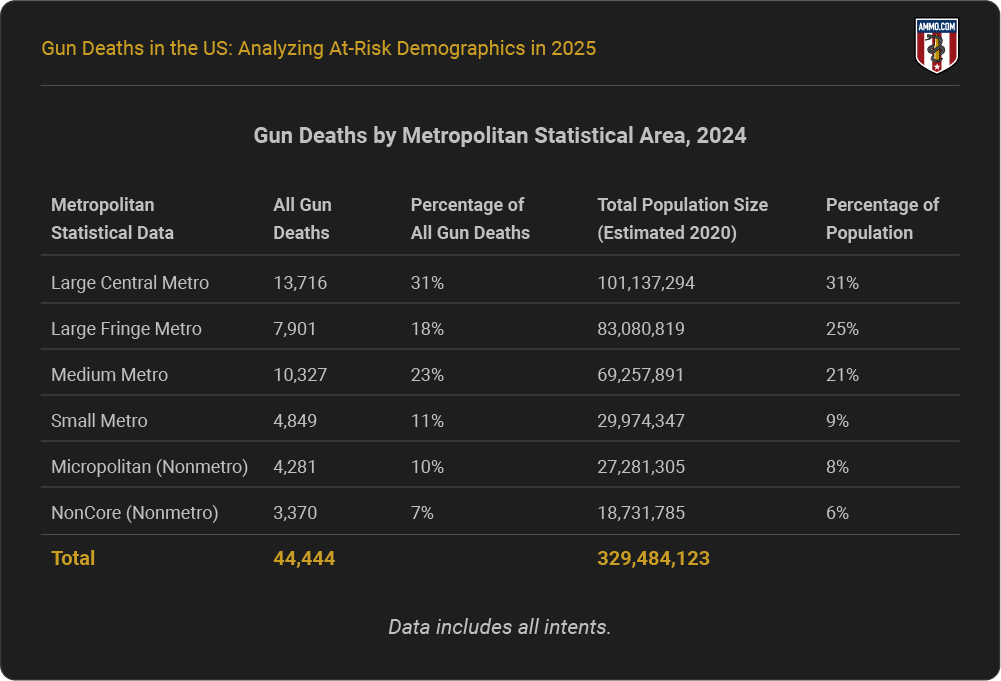
At-Risk Demographics by Population Size
In 2024, large central metropolitan areas accounted for 31% of the U.S. population and 31% of all gun deaths. Large fringe metros (suburbs) made up a quarter of the U.S. population and 18% of gun deaths. Medium metros carried a slightly higher share of deaths (23%) than their population share (21%).
Smaller and rural areas showed similar disparities. Small metros accounted for 9% of the population and 11% of deaths, while micropolitan areas were home to 8% of the population and accounted for 10% of deaths. Noncore rural areas represented 6% of the U.S. population and 7% of gun deaths.
Note: Rural areas have a higher rate of suicide, while urban areas have a higher rate of homicide.
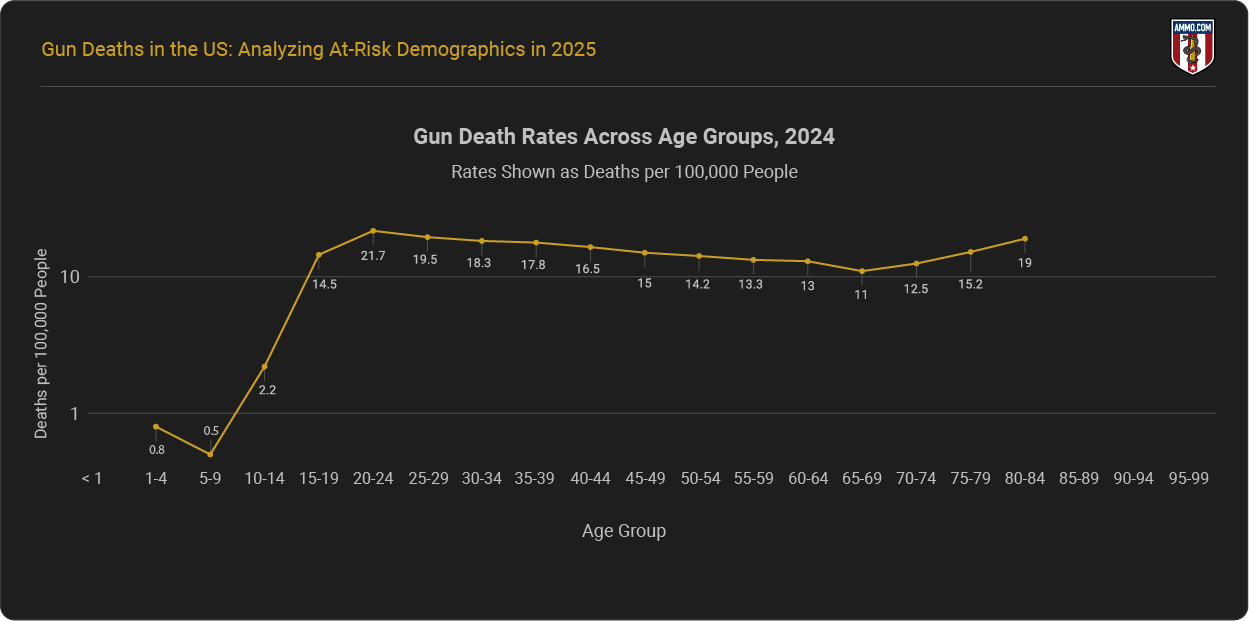
At-Risk Demographics by Age
Children under 10 are the least at-risk demographic regarding gun deaths, with fewer than 1 death per 100,000. Rates begin to climb in adolescence, reaching 2.2 per 100,000 among individuals aged 10–14, and then spike dramatically to 14.5 per 100,000 for those aged 15–19.
Young adults are at the greatest risk. The rate peaks at 21.7 per 100,000 for ages 20–24, gradually declines through middle age, and falls to around 13 per 100,000 in the early 60s.
In later years, the pattern reverses due to an increase in suicides. Rates rise again among older adults, reaching 19 per 100,000 at ages 80–84 – nearly as high as among young adults.
Continue reading Gun Deaths in the US: Analyzing At-Risk Demographics in 2025 on Ammo.com!
https://ammo.com/articles/gun-deaths-in-america#gun-violence-demographics-by-race-ethnicity