Gun deaths in America are a highly publicized and politicized talking point. Unfortunately, we rarely see solution-oriented discussions, and the most at-risk demographics are often overlooked.
The anti-gun lobby and American politicians speak often about children and adolescent gun deaths, while rarely speaking about the people who are actually dying. This article will analyze the most at-risk demographics, and shift conversations where they matter.
Report Highlights:
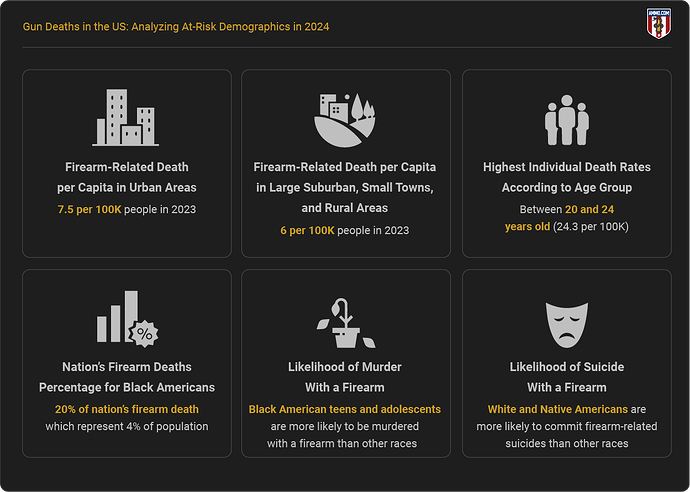
- Urban areas have 7.5 firearm-related deaths per 100k people.
- Large suburban areas, small towns, and rural areas have 6 firearm-related deaths per 100k people.
- Individuals between 20 and 24 die at higher rates than any other age group (24.3 per 100k).
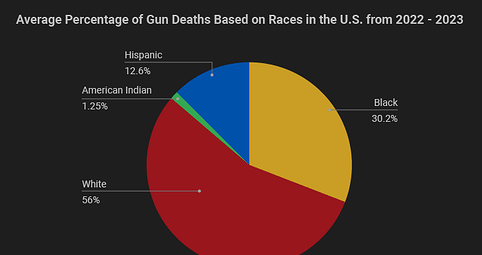
- Black Americans comprise 20% of the nation’s firearm deaths and represent only 4% of the population.
- Black Americans are more likely to be murdered with a firearm, and black American teens and adolescents die at much higher rates than other races.
- White and Native Americans are more likely to commit firearm-related suicides than any other race.
We strive to provide accurate and reliable information sourced from reputable databases. Our sources for this article are available here.
The Most At-Risk Demographics
The United States has had some form of federal gun control legislation for 90 years. Unfortunately, firearm-related deaths continue to occur at higher rates than other Western countries (and lower rates than many South American and African countries).
The U.S. is a unique country, however, and pinpointing solutions is challenging. To begin having more meaningful conversations about firearm-related deaths, it’s time to start discussing high-risk areas and the individuals most at-risk of firearm-related deaths.
By Population Size
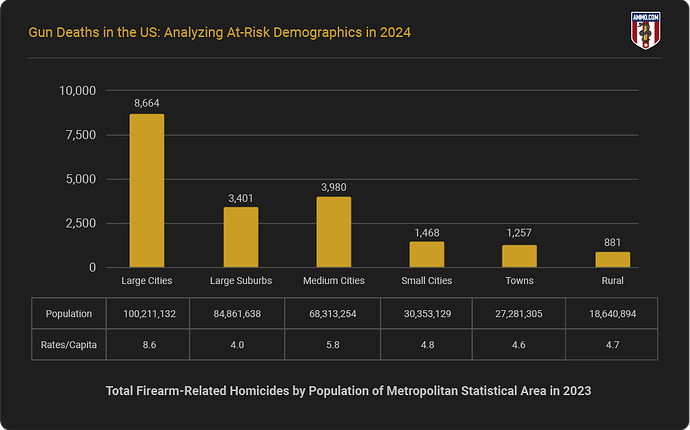
To better identify at-risk demographics, we must explore the correlation between population sizes and firearm-related deaths. More than half of all firearm-related deaths occur in large and medium-sized cities. Naturally, cities have more people, so total deaths should be higher. However, that isn’t the case.
Large suburban areas with one million or more people have lower homicide rates (per 100k people) than medium cities with between 250k and 999,999 people. Essentially, we’ve narrowed down the most at-risk people to metropolitan areas, as opposed to suburbs, small cities or towns, and rural communities.
The Discussion
Large and medium cities contributed 7.5 deaths per 100k people in 2023, whereas all other areas, including suburban areas with more than one million people, contributed only 6 per 100k combined.
Therefore, we must explore crime rates, and the effects of policing and criminal justice policies in densely populated cities with more than 250,000 residents.
By Age
We’ve all heard the media and politicians saying that guns are the number one killer of kids. Unfortunately, those who consistently debunk this misinformation are also missing a critical and life-saving discussion: What age groups are most at risk?
Exploring all firearm-related deaths (including homicide, suicide, unintentional shootings, and police intervention) by age group better helps us understand where we can focus our resources to bring down the entire nation’s homicide rates.
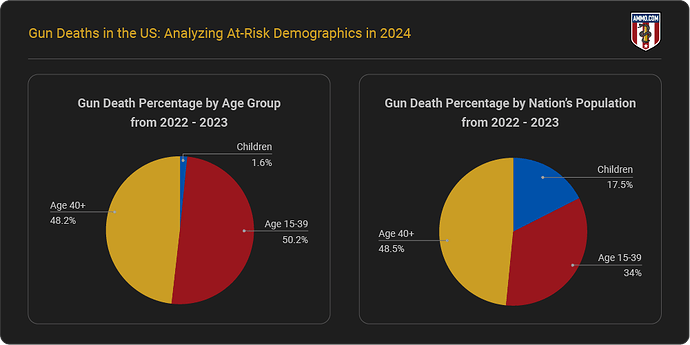
Children and adolescents below fourteen and younger are rarely killed with firearms. Individuals aged 20-24 had the highest rate of firearm deaths per capita at 24.3/100k in 2022 and 22.5/100k in 2023.
Next, individuals aged 25-29 had the second highest rate of firearm-related deaths at 23.5/100k in 2022 and 21/100k in 2023.
Adults aged 30 to 44 comprise the third, fourth, and fifth highest per capita rates, followed by teens (14-19) at 16.7/100k.
The Discussion
Not all of America’s children are at risk of firearm-related death, and blanket “guns are the number one killer of kids” statements deter meaningful conversations away from those who are most at risk of gun violence.
The risk of firearm-related death doesn’t begin until individuals reach age fourteen and peaks between age 19 and 24. The rates decline after individuals reach 34 years of age. Therefore, we must focus life-saving interventions and conversations to the most at-risk age groups.
By Race
Unfortunately, there are racial disparities among gun death victims. Although melanin levels do not affect criminality, there is a correlation between race and firearm-related deaths in the United States.
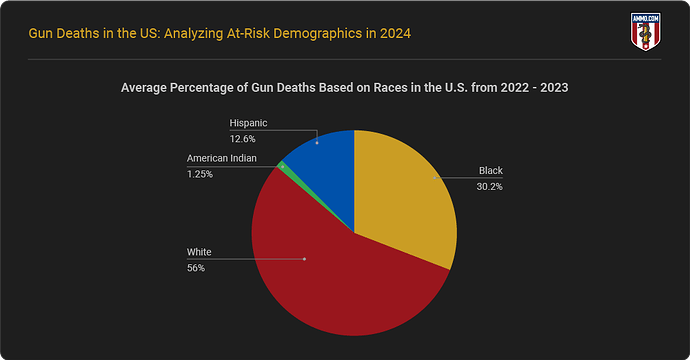
Black Americans are far more likely to die from a gun-related death than any other demographic. Unfortunately, black Americans of all age groups succumb to more fatal firearm injuries than any other demographic in all metropolitan statistical areas.
However, black males between the ages of 20 and 24 die at a rate of 89 per 100k in large cities and 77 per 100k in medium-sized cities. Black teens are also more likely to die than any other demographic in any other MSA in the same age group. Black teens between the ages of 15 and 19 die at a rate of 62.8 per 100k in large cities and 55.5 per 100k in medium-sized cities.
The Discussion
Young black Americans between the ages of 14 and 34 comprise 20% of the nation’s gun deaths and only 4% of the nation’s population. Conversely, white Americans in this same age group contribute only 14% of the nation’s gun deaths and comprise 14% of the population.
Sadly, black Americans comprise more firearm-related deaths than the population size would indicate, and many more than other races in the same age groups. To better combat firearm-related deaths in the U.S. we must discuss the disproportionality of deaths affecting black Americans.
Continue reading Gun Deaths in the US: Analyzing At-Risk Demographics in 2024
