Report Highlights
Gun deaths in the U.S. affect races, age groups, and genders differently. Some demographics die from gun violence at higher rates than others, while others account for larger shares of suicides and unintentional deaths.
-
According to the most recent FBI Supplementary Homicide Report data, males accounted for a larger share of firearm-homicide offenders (90.8%) and victims (84.2%) than females in 2020.
-
Non-Hispanic black Americans accounted for the largest share (57.5%) of gun violence deaths (homicide, legal intervention, and operations of war) from 2020 through 2025,* with a gun violence death rate of 24.8 per 100,000 individuals.
-
Adults 85 and older had the highest firearm suicide rate of any age group (16.9 per 100,000) from 2020 through 2025.* Those 65 and older accounted for 27.1% of all gun suicides.
We provide accurate and reliable information sourced from reputable databases. Our sources for this article are available HERE.
Methodology
This report draws on federal mortality and crime data to examine which demographics are most affected by gun deaths, and the circumstances surrounding those gun deaths.
The Centers for Disease Control and Prevention’s (CDC) Wide-ranging ONline Data for Epidemiologic Research (WONDER) database was used for gun death information, including by age, race, gender, community type, and intent (homicide, suicide, unintentional, undetermined, legal intervention/operations of war). WONDER data, which are incomplete for 2025 at the time of writing, were accessed between September 2026 and October 2026. These data are marked with an asterisk (*) and subject to change.
For this report, the term “gun violence” includes CDC designations such as homicides, legal intervention (deaths caused by law enforcement officers acting in the line of duty), and operations of war. Deaths of undetermined intent are included in total gun deaths, but not in gun violence, suicides, or unintentional figures. Suicides and unintentional deaths are reported separately.
In race and ethnicity breakdowns, Hispanic and non-Hispanic were drawn separately. Data are marked with the appropriate designation when ethnicities were factored into final counts. Age groups follow the CDC’s standard 10-year groupings, except for those under 15 and those 65 and older, which cover wider age ranges. The age graphic covers five-year age groups for a more granular view. All rates are per 100,000 people, and represent deaths from 2020 through 2025.*
Data on homicide offenders are drawn from the Federal Bureau of Investigation’s (FBI) Crime Data Explorer (CDE) and Supplementary Homicide Report (SHR). CDE data cover January 2020 through December 2025; SHR data, January through December 2020. Law enforcement participation in FBI reporting is voluntary and may undercount actual totals. FBI records include Hispanic and non-Hispanic ethnicity in race totals.
Who Commits the Most Homicides?
Per the SHR in 2020, males accounted for 90.8%, black Americans accounted for 63.5%, and individuals aged 25 to 49 accounted for 47.4% of all homicide offenders with known characteristics who used firearms. Males also accounted for 84.2% of firearm homicide victims with a known gender. 3
Across all weapons, between 2020 and 2025, male offenders accounted for the largest share of homicide perpetrators (87.8%) among genders. Black Americans accounted for the largest share of homicide offenders (57.4%) among races. Individuals aged 20 through 29 accounted for the largest share of offenders (35.3%) by age group. 2
Of the 105,555 homicides reported to the FBI between January 2020 and December 2025, 79,521 (75.3%) were attributed to firearms. 2 For a full breakdown of how homicides split across firearms, knives, and other weapons, see our study of murders by weapon type.
Gun Deaths by Age
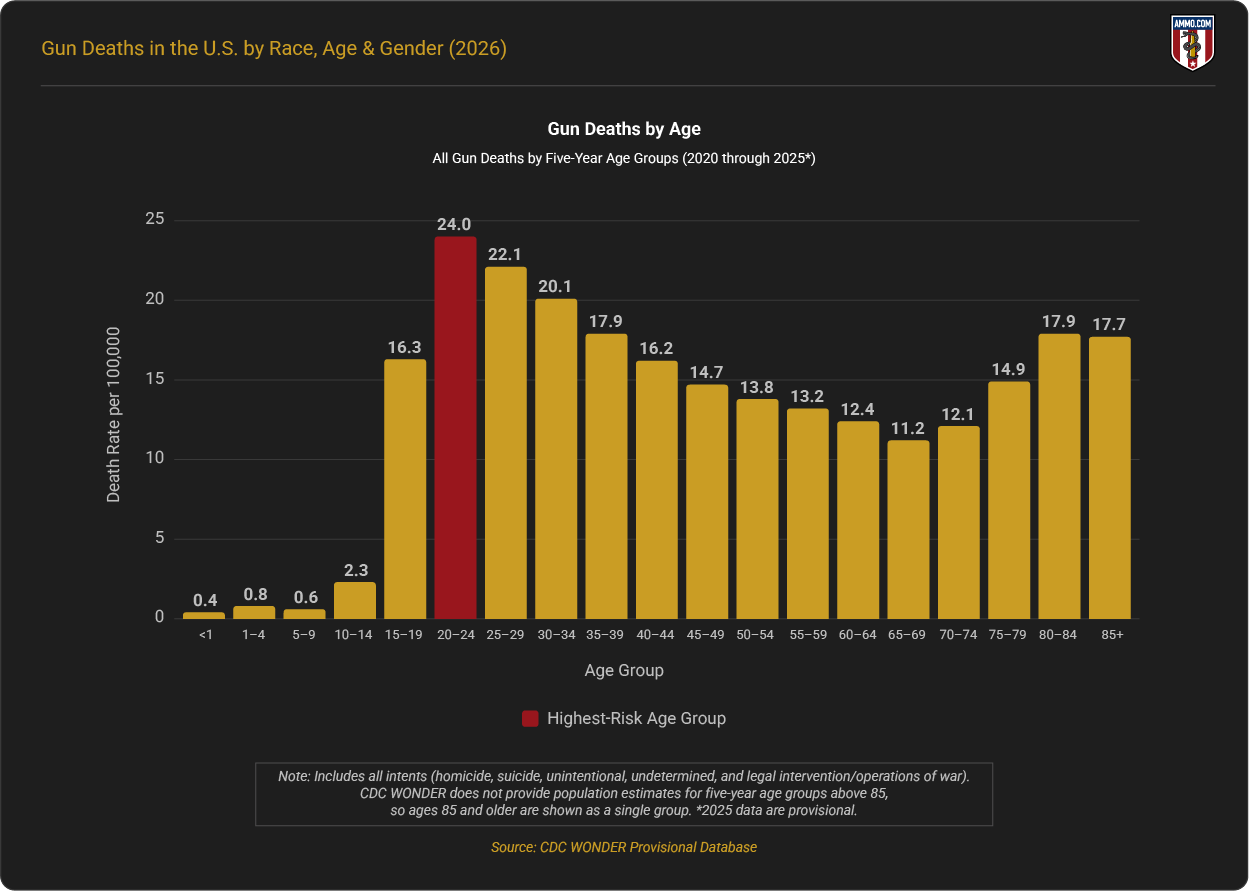
Gun death rates among age groups were lowest for those under 15 years of age (1.2 per 100,000) from 2020 through 2025.* Individuals in the 25 through 34 age group had the highest rate (21.0 per 100,000) of gun deaths, followed by those in the 15 through 24 age group (20.2 per 100,000). By five-year age group, those aged 20 through 24 had the highest rate at 24.0 per 100,000. 1
Those aged 35 through 44 had a gun death rate of 17.1 per 100,000, followed by 45 through 54 (14.2 per 100,000) and 55 through 64 (12.8 per 100,000). Those aged 65 through 74 had a gun death rate of 11.6 per 100,000. Gun death rates among those between 75 and 84, and those 85 and older were 16.1 per 100,000 and 17.7 per 100,000, respectively. 1
From 2020 through 2025,* individuals aged 25 to 34 accounted for the largest share (21.0%) of gun deaths, followed by 15- to 24-year-olds (19.3%), individuals 65 and over (17.3%), and those 35- to 44-year-olds (16.4%). Those aged 55 to 64 and those aged 14 and under accounted for the smallest shares of gun deaths (11.7% and 1.6%, respectively). 1
From 2020 through 2025,* more than half (58.3%) of gun violence (homicide, legal intervention, and operations of war) victims were between the ages of 15 and 34. Those aged 15 through 24 accounted for 29.0% of gun violence deaths, 25 through 34; 29.2%. Children and adolescents under the age of 15 accounted for the smallest share of gun violence deaths (2.2%), followed by those aged 65 and older (3.4%) and 55 through 64 (5.7%). 1
Individuals aged 85 and older had the highest firearm suicide rate of any age group (16.9 per 100,000). Individuals 65 and older accounted for the largest share (27.1%) of firearm-related suicides from 2020 through 2025.* Those aged 55 through 64 accounted for 16.0%, while 25 through 34 accounted for 15.5%. Individuals between the ages of 35 and 54 accounted for 14.1% of firearm-related suicides, while those under the age of 15 accounted for 0.8%. 1
Children, adolescents, and young adults accounted for the largest shares of unintentional gun deaths from 2020 through 2025.* Those aged 15 through 24 accounted for 24.5% of unintentional gun deaths, followed by those under 15 (18.5%) and aged 25 through 34 (15.6%). Other age groups accounted for smaller shares of unintentional gun deaths, with those aged 65 and older accounting for 12.1%, 35 through 44 accounting for 11.6%, and remaining age groups accounting for less than 9% each. 1
Gun Deaths by Race & Ethnicity
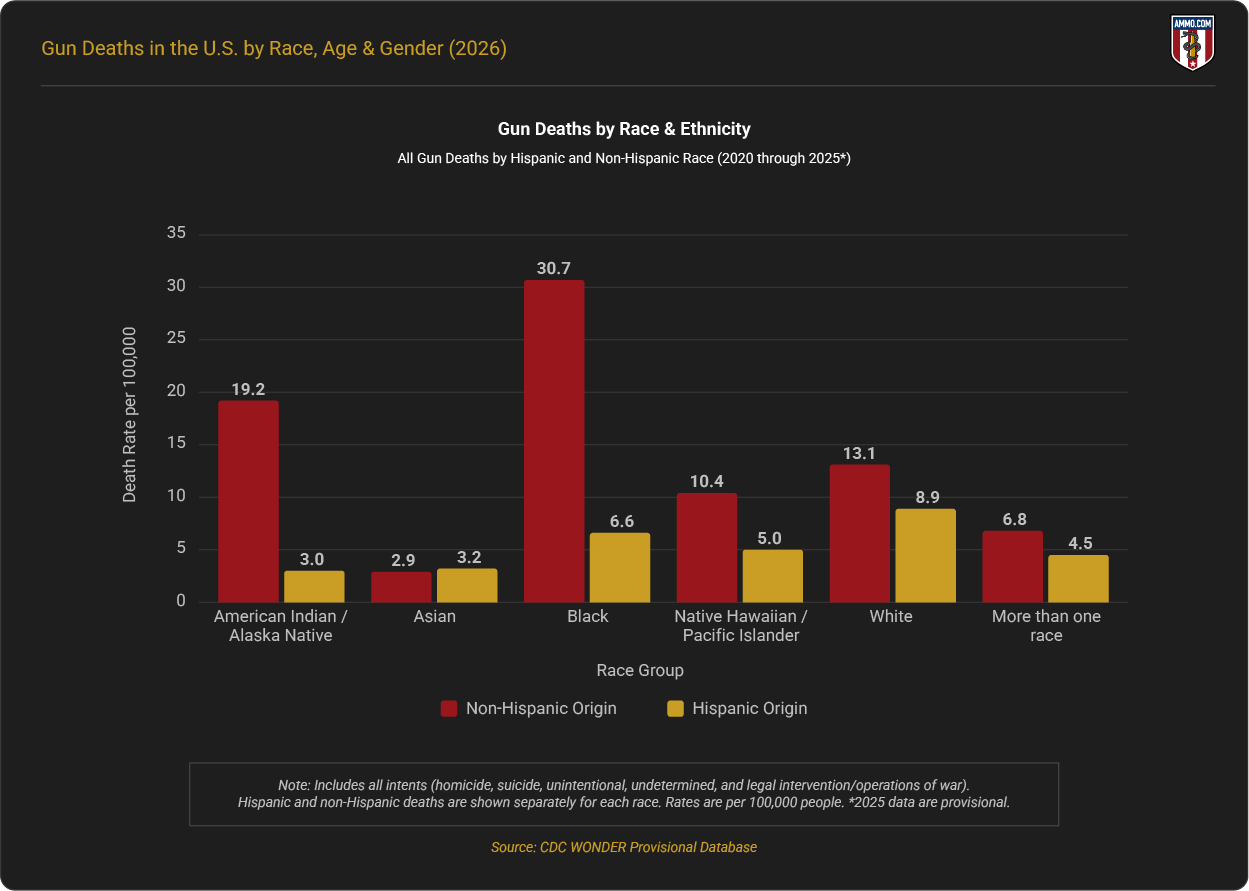
Non-Hispanic black Americans had the highest rate of gun fatalities (30.7 per 100,000) across all races from 2020 through 2025.* Non-Hispanic American Indians and Alaska Natives had the second-highest rate (19.2 per 100,000), followed by non-Hispanic white Americans (13.1 per 100,000) and non-Hispanic Native Hawaiian/Pacific Islanders (10.4 per 100,000). 1
Between 2020 and 2025,* suicide accounted for 58.2% of gun deaths, followed by gun violence (39.8%) and unintentional shootings (1.0%). Non-Hispanic white Americans accounted for the largest share of suicides and unintentional deaths, while non-Hispanic black Americans accounted for the largest share of gun violence. 1
Of all gun deaths (275,119) with known races between 2020 and 2025,* non-Hispanic white Americans accounted for 56.2% of gun deaths, followed by non-Hispanic black Americans (28.3%) and Hispanic white Americans (11.0%). 1
Non-Hispanic white Americans accounted for more than three-quarters of firearm-related suicides (80.1%), followed by non-Hispanic black Americans (8.3%) and Hispanic white Americans (7.5%). 1
Non-Hispanic black Americans accounted for the largest share (57.5%) of gun violence deaths (homicide, legal intervention, and operations of war), followed by non-Hispanic white Americans (21.3%) and Hispanic white Americans (16.0%). 1
Unintentional gun deaths accounted for 1.0% of all gun deaths between 2020 and 2025.* Non-Hispanic white Americans (56.2%) and non-Hispanic black Americans (27.2%) accounted for the largest shares of unintentional gun deaths during this period. The remaining unintentional gun deaths were spread across other groups, including Hispanic white Americans (11.2%). The CDC withholds counts of fewer than 10 deaths, so figures for some smaller groups are not shown. 1
For more on firearm homicide trends within this group, see our study of gun violence among black Americans.
Continue reading Gun Deaths in the U.S. by Race, Age & Gender (2026) on Ammo.com