Report Highlights
As of 2024, there were more than 73 million minors in the 0-17 age group. Of those, 2,228 (0.003%) suffered gun-related fatalities.
-
3.0Per 100,000, tied with motor vehicles
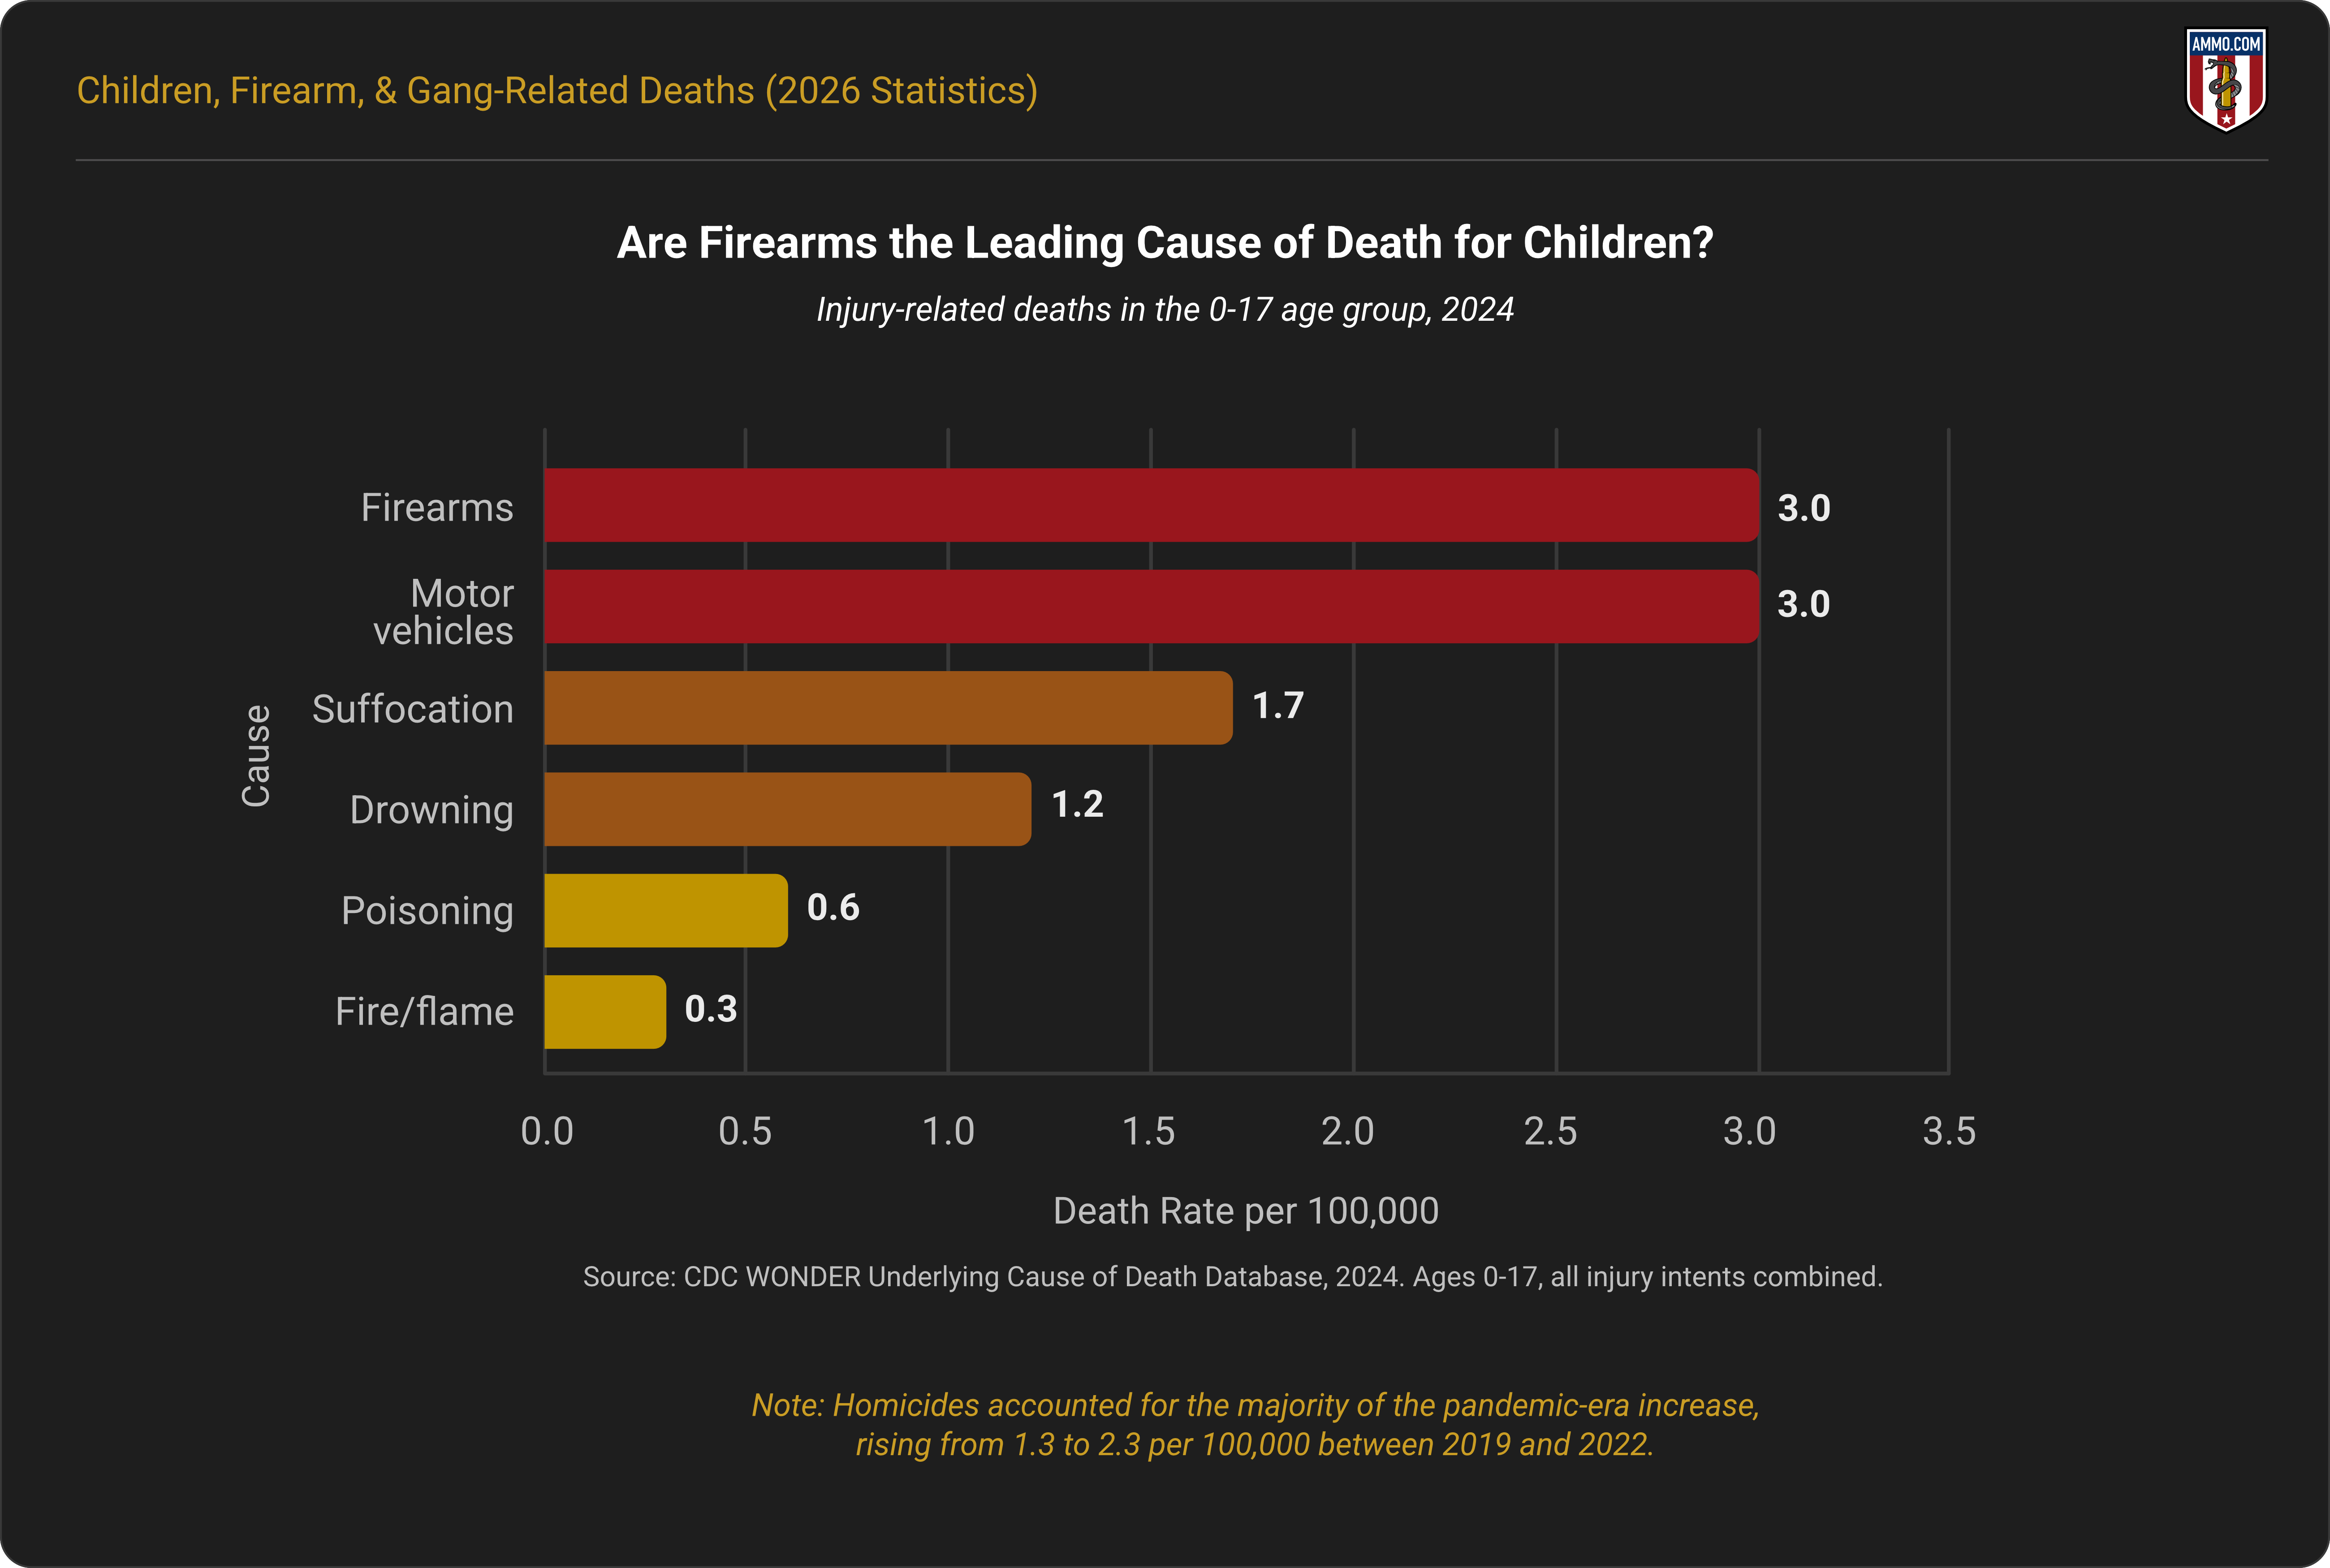
In 2024, firearms and motor vehicles tied as the leading cause of injury-related death in the 0-17 age group (3.0 per 100,000).
-
▲76.9%Homicides, 2019 to 2022
The pandemic-era spike in gun deaths among U.S. minors was primarily driven by homicides, which increased by 76.9% (1.3 to 2.3 per 100,000) from 2019 to 2022.
-
More than one-third of gang violence offenders and more than one-quarter of gang violence victims were under 18 years of age between 2021 and 2024.
Ammo.com provides accurate information from reputable sources. You can view the sources cited in this article.
Methodology
All firearm death data in this report were sourced from the CDC WONDER Underlying Cause of Death and CDC WONDER Provisional Mortality Statistics databases. Raw death counts, population size, and crude rates were obtained directly from the CDC WONDER database when available for the single-year age group (0-17).
Where noted, 2025 data are provided to show more recent trends, but these data are provisional at the time of writing. Death totals and rates will change as the database becomes more current.
Urban and rural deaths were classified using WONDER’s 2023 Urbanization categories. Population rates for the 0-17 age group by metropolitan statistical area (MSA) are unavailable in the WONDER database and in U.S. Census Bureau data. The data presented are a share of gun deaths by MSA, rather than adjusted for population.
Gang-related gun deaths are not consistently tracked or reported in the U.S. All gang-related data in this report are sourced from government sources and national surveys.
Are Firearms the Leading Cause of Death for Children?
In 2024, firearms and motor vehicles accounted for the highest rate of injury-related deaths in children and adolescents (0-17 age group) at 3.0 per 100,000.2
Although incomplete at the time of writing, data available in 2025 showed a 10% decline in the adolescent gun death rate (2.7 per 100,000) from 2024. Per the available data, motor vehicles were associated with 3.0 deaths per 100,000 in 2025.3
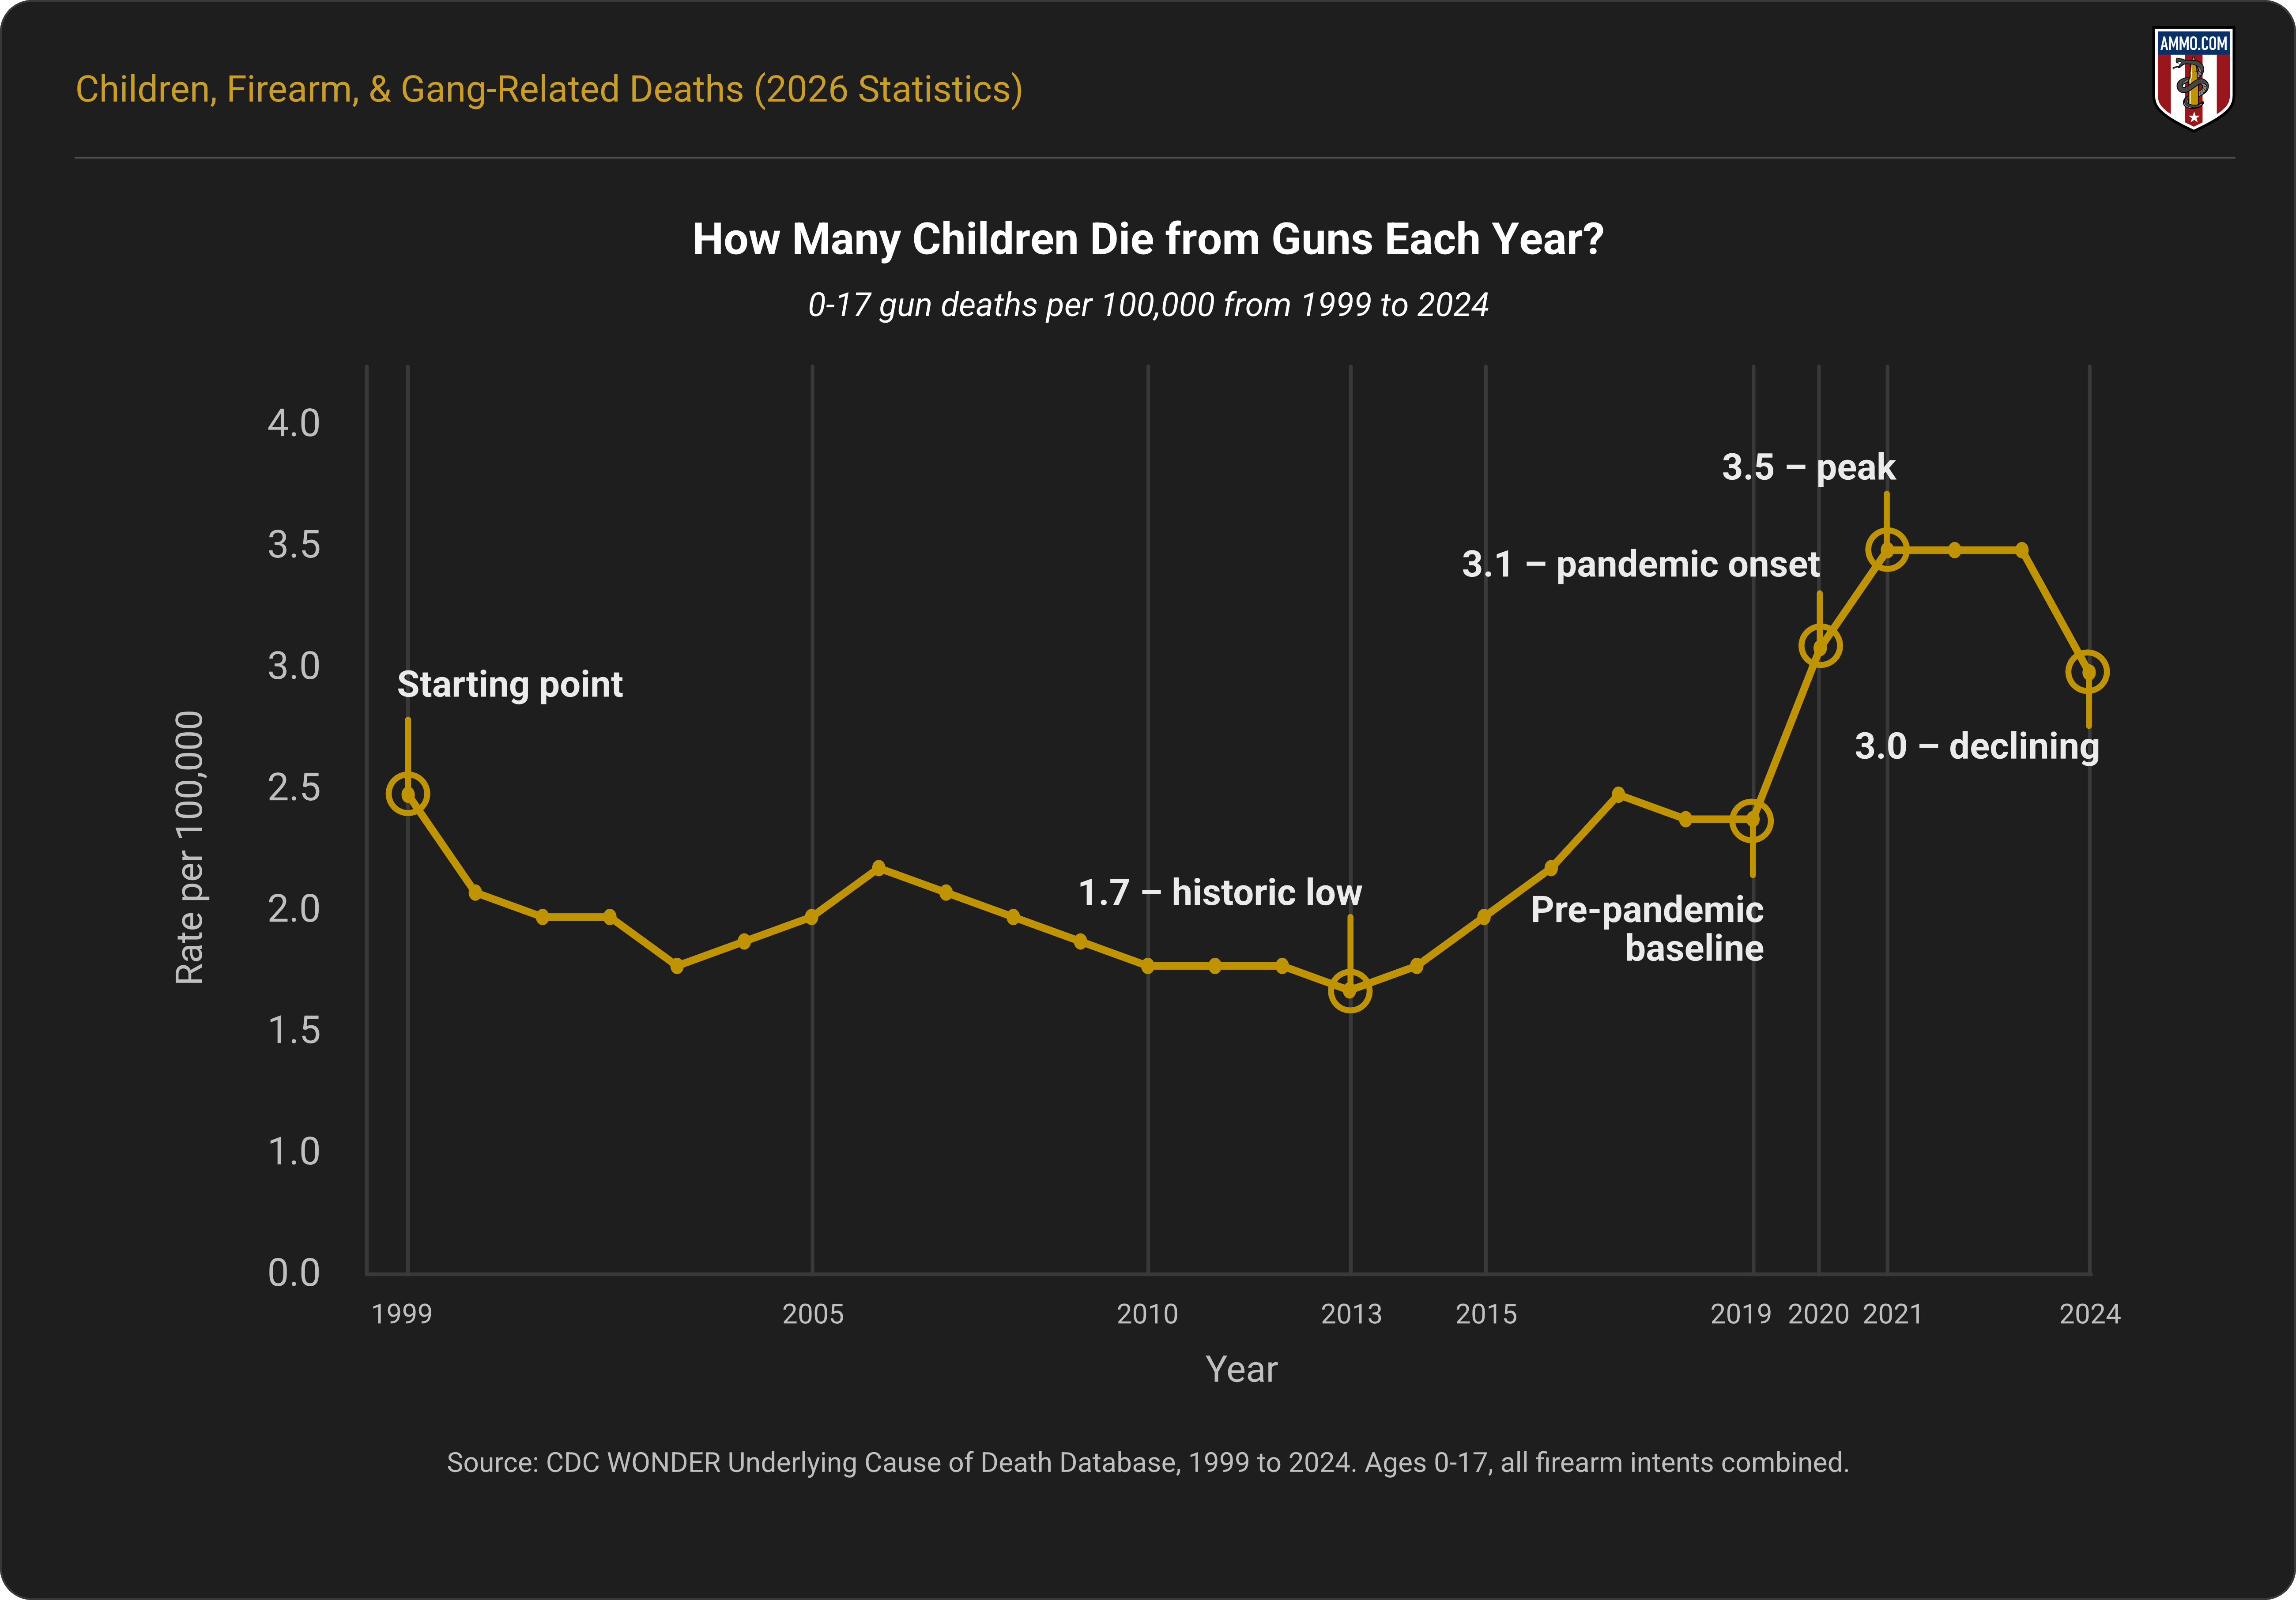
In 2018 and 2019, the gun death rate in the under-18 age group was 2.2 per 100,000. Gun deaths began increasing in 2020 (3.1 per 100,000) and remained at 3.5 per 100,000 from 2021 to 2023, before gradually declining to 3.0 in 2024 and 2.7 in 2025 (provisional).2
Homicides primarily drove the increase in gun deaths during and following the COVID pandemic. From 2019 to 2022, firearm-related homicides in this age group increased from 1.3 per 100,000 to 2.3 (76.9%). Firearm-related suicides remained at 0.9 per 100,000 before the pandemic and into 2022. Unintentional firearm-related deaths increased slightly from 0.1 per 100,000 in 2019 to 0.2 per 100,000 in 2022.2
How Many Children Die from Guns Each Year?
Between 1999 and 2019, an average of 1,489 (2.0 per 100,000) children and adolescents (0-17) died from gunshots. During and following the COVID pandemic, adolescent and child gun deaths increased by 50.4% to an average of 2,240 per year.2, 3, 8
The rate of gun deaths among the 0-17 age group spiked to 3.5 per 100,000 in 2021, 2022, and 2023. In 2024, gun death rates declined to 3.0 per 100,000. Preliminary 2025 data show the rate falling to 2.7 deaths per 100,000.2
Accidental Gun Deaths Statistics
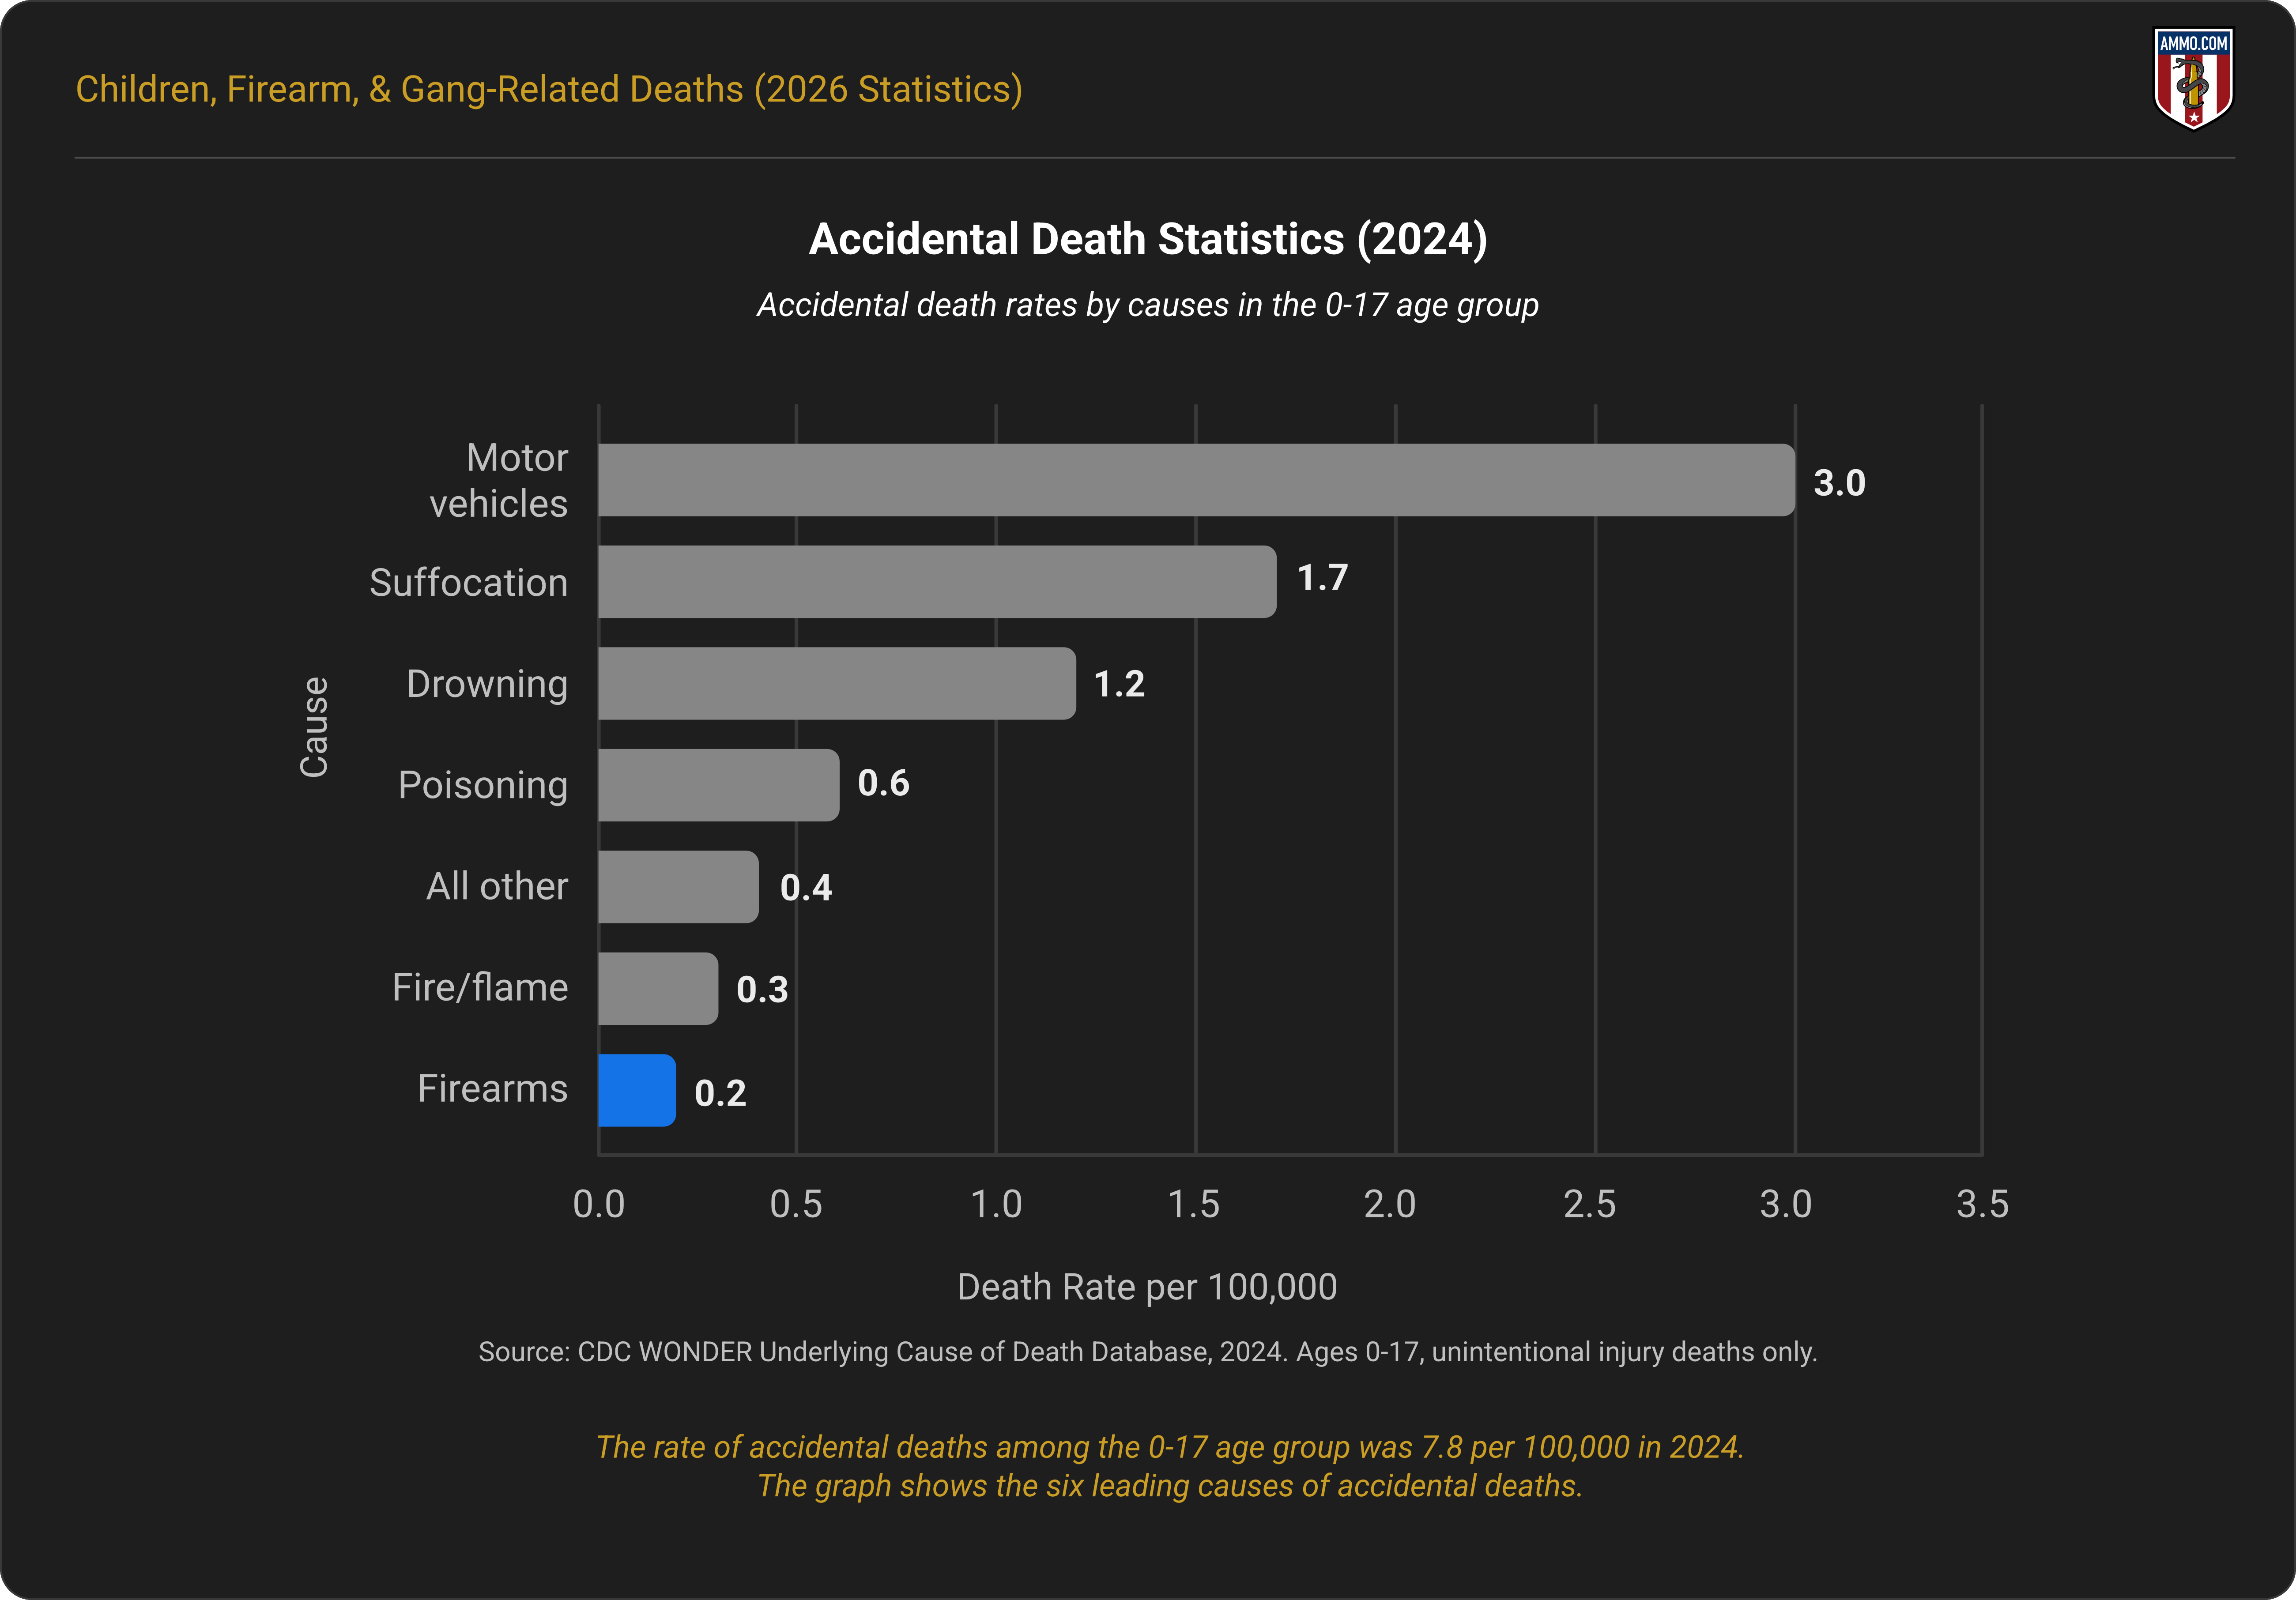
In 2024, children and adolescents died from accidental injuries at a rate of 7.8 per 100,000. Motor vehicles (3.0 per 100,000), suffocation (1.7 per 100,000), drowning (1.2 per 100,000), poisoning (0.6 per 100,000), and fire (0.3 per 100,000) were the most common mechanisms of death that year.2
Accidental gun deaths in the 0-17 age group are rare. There were 125 unintentional gun deaths among this group in 2024. This equates to 0.2 deaths per 100,000 in the age group.2
For a wider view of unintentional firearm deaths across every age group, see our review of accidental shooting statistics.
Urban and Rural Children’s Firearm Deaths
Of the 2,175 gun deaths (0-17 age group) reported by MSA in 2024, more than one-third occurred in large central metros (35.6%). Medium-sized cities accounted for 21.1% of gun deaths. Large suburban areas accounted for 18.9% of all gun deaths, followed by micropolitan areas (8.9%), small metros (8.3%), and rural noncore areas (7.2%).2
Child-specific population estimates were unavailable for these MSAs, so per capita comparisons across these areas are not possible. What the data do reveal, however, is a striking difference in how children are dying from gun-related deaths depending on where they live.1
In 2024, homicide was the leading factor in gun-related deaths in large central metros (75.2%), medium-sized cities (63.7%), and large suburban areas (58.5%). Homicides accounted for less than half of all child and adolescent gun deaths in micropolitan areas (44.0%), small cities (43.1%), and rural noncore areas (34.4%).2
Alternatively, suicides were the leading factor in gun-related deaths in more rural areas. Suicides in noncore rural areas accounted for most gun deaths (54.8%), and nearly half of all gun deaths in smaller cities (49.2%) and micropolitan areas (45.6%). Suicides were a factor in 38.0% of gun deaths in large suburban areas and 29.1% of deaths in medium-sized cities. Suicides were rarely attributed to gun deaths in large central metros (16.9%).2
Accidental gun deaths were more common in noncore rural areas (10.8%), micropolitan areas (10.4%), small cities (7.7%), and medium-sized cities (7.2%) than in large central metros (3.5%) or large suburban areas (3.4%).2
Our analysis of what percentage of gun deaths are suicides breaks the split down across all age groups.
Continue reading Children, Firearm, & Gang-Related Deaths (2026 Statistics) on Ammo.com
https://ammo.com/articles/adolescent-firearm-related-death-statistics#children-gun-deaths-by-age